


West Virginia asks more of a solar buyer than most states do, and it gives less help. The sun is weaker here than in nearly every state to the south and west. The houses use more power than the national average, partly because so many of them heat with electricity through long Appalachian winters. The roofs sit under ridges and trees that steal light a flat-state roof never loses. And the help that used to soften the price is gone: the federal credit ended, the state never had one of its own, and the $106 million federal Solar for All award for low-income households was canceled before a single home was served.
What remains is a straight commercial question, and it is answerable. Panels cost about the national average to install here. The power they replace costs less than the national average. The credit for power sent back to the grid now depends entirely on which company sends the bill, and the two credits differ by a third. A buyer who knows the installed price, the yield on their own roof, and the exact export credit on their own tariff can work out whether solar pays, and how fast, without trusting any salesperson’s spreadsheet.
The bill at the top of the pile is the document that matters most. Appalachian Power serves Charleston, Huntington, and Beckley and most of the southern and central counties. Mon Power serves Morgantown, Clarksburg, Fairmont, and Parkersburg and most of the north. Wheeling Power serves the Wheeling area, and Potomac Edison serves the Eastern Panhandle. Each pair shares an export credit, and the pairs do not match. A quote that does not name the utility and the credit it assumes is not a quote worth comparing.
One more fact belongs before the prices. West Virginia homes are old. Fifty-six percent were built before 1980, and many still run on 100-amp electrical service that a modern solar system outgrows. Old roofs, old panels, and ridge shade are the three reasons a West Virginia quote runs above the planning band, and all three are visible before anyone signs anything. This guide prices the system, then prices the work around it, so neither hides inside the other.
Countrywide prices and the federal rules shared by every state are set out in our national solar panel cost guide. What follows prices West Virginia on its own terms: the state cost model, four cities, both export credits, and the payback arithmetic for each utility, with a source and a date on every figure that carries one.
Table of Contents
How Much Do Solar Panels Cost in West Virginia in 2026?
NumeralQ’s estimator pricing, dated October 26, 2026, puts a West Virginia 8 kW rooftop install at $19,210–$25,110. In per-watt terms the band runs $2.40–$3.14, and the payback arithmetic later in this guide works from the band’s middle, close to $22,160. NumeralQ builds its figures from a national cost model adjusted for West Virginia materials and labor, and it labels them planning estimates, not records of what West Virginia homeowners actually paid. This guide keeps that label.
The band is wide, and the width is honest. A simple roof with good access, a sound 200-amp panel, and open southern sky lands near the bottom. A steep roof in a hollow, a panel upgrade, tree work, and a long wire run land near the top or above it. A quote inside the band for an ordinary asphalt-shingle roof with straightforward access is a fair quote. A quote far above $3.14 a watt needs a clear reason stated in writing, such as roof complexity, premium equipment, or preparation work folded into the job.
Two marketplace-based trackers land inside the NumeralQ band from different directions, and their agreement is reassuring. EnergySage, working from real quotes on its marketplace and updated November 6, 2026, puts West Virginia at $2.88 per watt, with its average 12.14 kW system at $34,921 before incentives and a range of $29,683–$40,159. Its size table prices an 8 kW system at $23,009, almost exactly the NumeralQ midpoint. EcoGen’s Solar Cost Index, September 2026 edition with prices as of September 25, 2026, puts West Virginia at $2.93 per watt, with its typical 9.70 kW system at $28,421, and its 8 kW quote range at $20,800–$26,500.
The neighbors all price below West Virginia on the EcoGen index, which makes this the dearest solar market in its region. Kentucky sits at $2.65, Ohio at $2.77, Virginia at $2.79, Maryland at $2.80, and Pennsylvania at $2.87 a watt, against a $2.89 national average and West Virginia’s $2.93. The gap is small in cents and large in meaning: there is no cheap-installer advantage here to offset the weak sun and the missing incentives. For the Kentucky figures, see our Kentucky solar panel cost guide, and for Virginia, our Virginia solar panel cost guide.
Two lower figures circulate and should be read with care. ElectricChoice, updated October 25, 2026, puts West Virginia at $2.60 a watt with an 8 kW system near $20,800 on its model, and RenewEstimator puts it at $2.54 a watt with an 8 kW system at $20,320. Both sit below every marketplace-based figure, and RenewEstimator pairs its low price with 4.7 peak sun hours a day, well above every other sun estimate for the state. Treat both as low-side models, not as prices an installer has offered. At the other end, SolarReviews publishes two different West Virginia figures, $2.93 a watt on its state page and $2.83 on its national table, and its state page still subtracts the expired 30 percent federal credit in its after-credit column. Its gross per-watt figures are usable; its net prices are not, and the conflict between its own two pages is noted here rather than resolved by picking one.
What the installed price buys is a working system, switched on and producing: panels, inverter hardware in one of two forms, a single string inverter or a microinverter behind each panel, racking and flashing, wiring with disconnects, permit and inspection fees, the crew’s labor, and the startup visit. The costs that surprise West Virginia buyers sit outside that price, because the work around the system is billed separately and the state’s old housing stock so often needs it.
- Roof repairs or a roof replacement before the panels go on, priced on its own
- An electrical panel upgrade, if the existing service cannot take the solar backfeed
- A battery, priced separately and covered in its own section below
- Tree removal or trimming where ridge or canopy shade falls on the roof, $500–$3,000 on EcoGen’s range
- Sales tax on the equipment at the 6 percent state rate, unless the quote states otherwise, with the labor nuance explained in the tax section
- The $30 Level 1 interconnection application fee, and any utility charges the quote must name
West Virginia labor is not the reason a quote runs high. Bureau of Labor Statistics figures for May 2025, quoted through NumeralQ, put the median West Virginia solar installer at $22.82 an hour, billed out near $46–$59 per worker-hour. Charleston electricians sit 3 percent above the national median. A quote far above the band usually traces to one of three causes, the equipment chosen, a hard roof or site, or the installer’s margin, and the installer should be able to name the cause in a single sentence.
| Source | Price per watt | 8 kW total | Basis |
|---|---|---|---|
| NumeralQ (Oct 2026) | $2.40–$3.14 | $19,210–$25,110 | Planning estimate, state model |
| EnergySage (Nov 2026) | $2.88 | $23,009 | Marketplace quotes, size table |
| EcoGen Index (Sept 2026) | $2.93 | $20,800–$26,500 | Cost index, cash, before incentives |
| SolarReviews (Nov 2026) | $2.83–$2.93 | Not published for 8 kW | Two pages conflict; gross only |
| ElectricChoice (Oct 2026) | $2.60 | About $20,800 (scaled) | Low-side model |
| RenewEstimator (2026) | $2.54 | $20,320 | Low outlier; sun hours overstated |
The ElectricChoice 8 kW figure in that table is scaled from its per-watt average, not a total that source publishes for an 8 kW system, and it is labeled as such. What matters is that the three strongest sources land in the same place: near $2.88–$2.93 a watt at the middle of the range, with the NumeralQ band wide enough around that center to hold most real quotes. Collect written quotes from three licensed installers, each pricing the same scope of work. Any bidder who will not name the panel model, the inverter type, the year-one production estimate, and the export credit behind the savings math should be dropped. A West Virginia estimate that values every exported kilowatt-hour at the retail price is valuing it under a rule that no longer admits new customers.
Solar Panel Cost in West Virginia by System Size
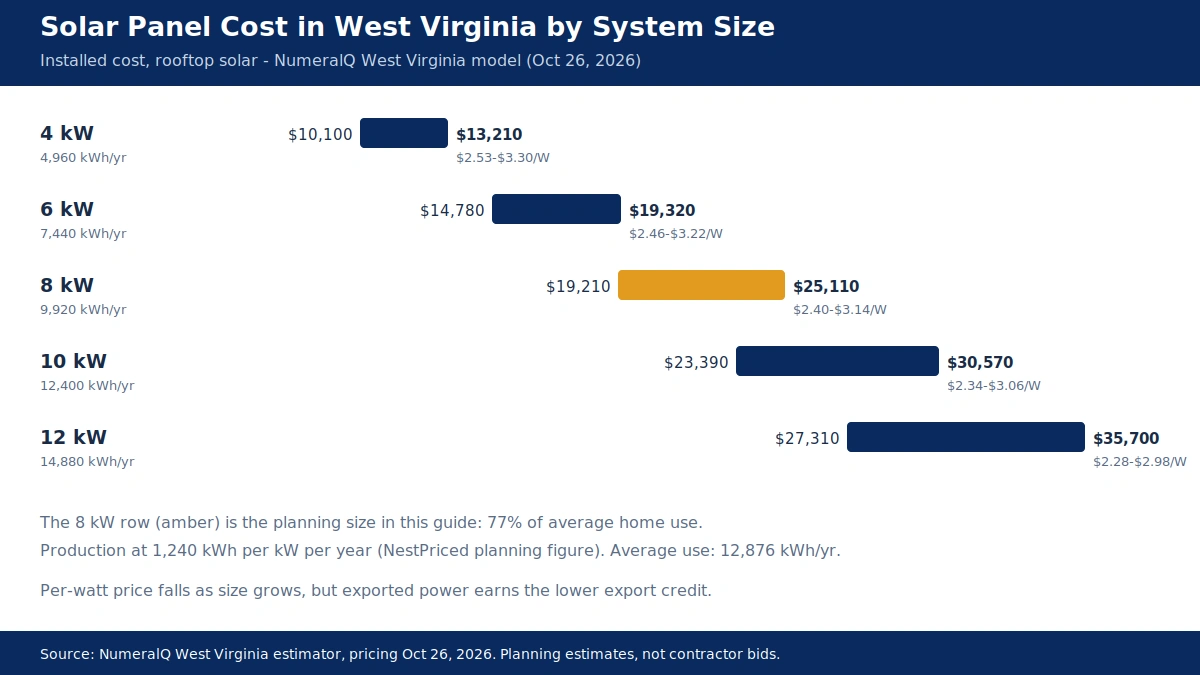
Kilowatts, written kW, name the peak output a set of panels can reach under full sun, and every size in this guide is stated in those units. Fixed job costs, the crew visit, the permit, the inverter, stay roughly the same whatever the size, so adding panels raises the total while pulling the price of each watt down. The table that follows runs the full NumeralQ West Virginia range, pairing each size with the yearly production at 1,240 kilowatt-hours per kilowatt and the share of the average West Virginia home’s 12,876 kilowatt-hours a year that production covers.
| System size | Installed cost | Cost per watt | Yearly production | Share of average use |
|---|---|---|---|---|
| 4 kW | $10,100–$13,210 | $2.53–$3.30 | 4,960 kWh | 39% |
| 5 kW | $12,470–$16,300 | $2.49–$3.26 | 6,200 kWh | 48% |
| 6 kW | $14,780–$19,320 | $2.46–$3.22 | 7,440 kWh | 58% |
| 7 kW | $17,030–$22,260 | $2.43–$3.18 | 8,680 kWh | 67% |
| 8 kW | $19,210–$25,110 | $2.40–$3.14 | 9,920 kWh | 77% |
| 9 kW | $21,330–$27,880 | $2.37–$3.10 | 11,160 kWh | 87% |
| 10 kW | $23,390–$30,570 | $2.34–$3.06 | 12,400 kWh | 96% |
| 11 kW | $25,380–$33,180 | $2.31–$3.02 | 13,640 kWh | 106% |
| 12 kW | $27,310–$35,700 | $2.28–$2.98 | 14,880 kWh | 116% |
Costs: NumeralQ West Virginia estimator pricing, October 26, 2026. Production and coverage: NestPriced arithmetic at 1,240 kWh per kW per year against 12,876 kWh average annual use (1,073 kWh a month, EIA Form EIA-861 2025 final data). Count panels at 400 watts each, and an 8 kW array needs 20 of them, a 6 kW array 15, and a 10 kW array 25, before setbacks and shade take roof space away.
From the smallest to the largest size in the table, the per-watt price slides from $2.53–$3.30 at 4 kW down to $2.28–$2.98 at 12 kW. Falling per-watt prices are normal, and they pull buyers toward filling the whole roof. In West Virginia that temptation needs a check, because exported power earns the lower export credit rather than the retail price, and a system that makes far more than the home uses sends a growing share of its output out at the lower rate. The payback section works through that trade in numbers. The short version is that size follows the bill, not the roof.
West Virginia systems run large for a plain reason: the homes use a lot and the sun gives a little. The average home’s 12,876 kilowatt-hours a year needs about 10.4 kW of panels at the planning yield to cover fully on an annual basis, which is why EnergySage’s average West Virginia system is 12.14 kW and EcoGen’s typical system is 9.70 kW. An 8 kW system, the planning size used through this guide, covers about 77 percent of average use. That is not a failure. It is the size at which most of the output gets used at home, where each kilowatt-hour is worth the most, and it keeps the upfront check inside the range most households can actually fund.
The right size follows the home’s own bills over the last 12 months, not the state average and not the roof’s capacity. For a household using around 700 kilowatt-hours a month, near 8,400 a year, a 7 kW array covers the load well. A home at the state average of 1,073 a month fits a 10 kW system on annual math, though an 8 kW system may still be the better buy once the export credit is counted. Electric vehicles, heat pumps, and electric resistance heat can push a home past 1,400 kilowatt-hours a month, a load that supports 12 kW, but the load on the bills must justify the extra panels, not the cheaper per-watt price of a bigger array. A home that uses under 600 kilowatt-hours a month should think twice: EcoGen’s warning is blunt, and it is right, that a small system costing $15,000–$20,000 and saving $600–$1,000 a year does not earn its upfront cost in any reasonable time.
Roof space rarely binds first in West Virginia. A 20-panel array of 400-watt panels takes roughly 350 to 400 square feet of usable roof, and a typical single-family roof holds more than that once its south, east, and west faces are added together. Shade, roof age, and roof direction bind sooner: a ridge or a stand of oaks that shades the south face, or a roof that needs replacing within five years, should be dealt with before panels are priced at all. Roof costs, priced nationally, are set out in our national roof replacement cost guide. Our 6 kW, 8 kW, and 10 kW solar system cost guide compares the common sizes at the national level. The national guide prices the same three sizes across the country; the table above is the West Virginia version, and the two agree that the size decision starts with the bill.
Solar Panel Cost by City: Charleston, Huntington, Morgantown, and Parkersburg
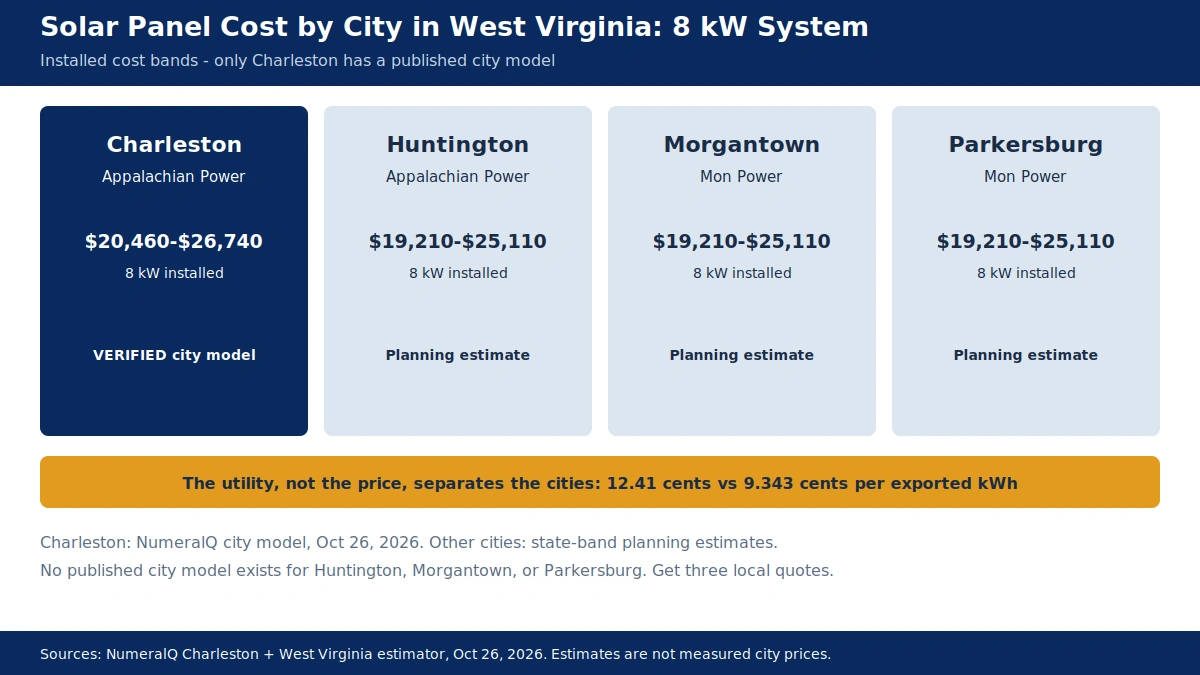
Only one West Virginia city has a published cost model. NumeralQ publishes an estimator page for Charleston, and no equivalent page was found for Huntington, Morgantown, or Parkersburg. The figures for those three cities below are planning estimates drawn from the statewide band, labeled as such, and a local quote is the only real price in any of them. The city pages that do circulate for Huntington and Morgantown from lead-generation sites still subtract the expired 30 percent federal credit, and none of their figures is used here.
| System size | Charleston | Huntington (estimate) | Morgantown (estimate) | Parkersburg (estimate) |
|---|---|---|---|---|
| 4 kW | $10,760–$14,060 | $10,100–$13,210 | $10,100–$13,210 | $10,100–$13,210 |
| 6 kW | $15,750–$20,580 | $14,780–$19,320 | $14,780–$19,320 | $14,780–$19,320 |
| 8 kW | $20,460–$26,740 | $19,210–$25,110 | $19,210–$25,110 | $19,210–$25,110 |
| 10 kW | $24,910–$32,550 | $23,390–$30,570 | $23,390–$30,570 | $23,390–$30,570 |
Charleston: NumeralQ estimator pricing, October 26, 2026. Huntington, Morgantown, and Parkersburg: NestPriced planning estimates using the statewide NumeralQ band; no published city model exists for any of the three. At 8 kW, Charleston runs close to $1,250 above the statewide band, a gap that reflects city labor and permit costs, not different equipment.
Charleston is the state capital, the seat of Kanawha County, and Appalachian Power territory. The city bands above are the price to hold a Charleston quote against, and the 12.41-cent export credit, covered in the utility sections, is what separates a Charleston payback from a Morgantown one. Charleston’s median home costs $203,300 (American Community Survey 2020–2024, via NumeralQ), so an 8 kW system at the city midpoint costs about 11.6 percent of the median home’s value, the 23rd highest share of the 147 markets NumeralQ covers. Sixty-three percent of Charleston homes are owner-occupied and 70 percent of units are houses, so most Charleston buyers face no landlord or association barrier beyond the covenant rules explained in the lease section.
Huntington sits on the Ohio River in Cabell County, also Appalachian Power territory, which means a Huntington buyer gets the same 12.41-cent export credit as a Charleston buyer and should expect a similar price band, though no published Huntington model confirms it. Huntington’s distinct fact is hail: 36 hail days were recorded within 15 miles of the city center since 2010, the most of any West Virginia city on the Cloudbreak tabulation of NOAA Storm Prediction Center data, with hail up to 3.0 inches. Panel durability and the hail rating are buying questions in Huntington, not footnotes, and the weather section takes them up directly.
Morgantown sits in the north, in Monongalia County, served by Mon Power, with a housing market split by West Virginia University between newer builds and student rentals near campus and older homes downtown and in the hollows. No verified Morgantown price was found, so the statewide band applies, and the practical difference in Morgantown is the export credit, not the price: 9.343 cents instead of 12.41, set only through December 31, 2026. Morgantown’s sun runs a little weaker than Charleston’s, about 3 percent less per kilowatt on PVWatts modeling, and its winters run a little colder, which matters for the snow discussion in the production section.
Parkersburg sits on the Ohio River in Wood County, also Mon Power territory, and it shares Morgantown’s export credit and the same absence of a published city price. A Parkersburg buyer should hold quotes against the statewide band and insist on the same written utility terms as a Morgantown buyer: the current export credit, the fixed charges, and the interconnection steps, all from Mon Power in writing. The Ohio River valley cities, Huntington and Parkersburg, share river fog and valley shade patterns that a rooftop shade report will capture better than any state average can.
The add-on costs that surprise buyers are published for Charleston and worth stating plainly, since they travel well as planning figures for the other three cities. A battery of 10 to 13 kilowatt-hours costs $10,290–$15,910 installed in Charleston, and a main panel upgrade costs $2,220–$3,480, both on NumeralQ’s model. Treat both numbers as planning estimates, and insist that any quote carrying them shows each on its own line instead of folding them into the per-watt price. See our electrical panel upgrade cost guide for the standalone price of that work.
A final fact about the housing stock applies in all four cities alike. West Virginia’s housing stock runs old: close to 56 percent of homes went up before 1980, and those older homes more often need electrical or roof work before an installer can mount panels. Two homes can share one panel price and still land thousands apart once preparation work enters the picture, which is why a 1955 Charleston bungalow and a 2021 Morgantown build need quotes that price the system and the preparation on separate lines.
West Virginia Sun, Ridge Shade, and Snow: What a Kilowatt Makes Here
West Virginia is one of the least sunny states in the lower 48, and the guide says so plainly because every savings estimate depends on it. Peak sun hours, the number of hours of full-strength sun the site receives in a day, run about 3.65 to 4.0 across the state on NREL PVWatts figures quoted by EcoGen. Charleston’s year average on one NREL-sourced insolation table is 3.65 peak sun hours, with 4.12 in summer and 2.47 in winter. Do not read a peak sun hour as an hour on the clock. It is the energy of one hour of sun at full strength, 1,000 watts on each square meter, and it is the measure that converts a panel’s wattage into the energy it makes across a year.
The yield this guide plans around is 1,240 kilowatt-hours per kilowatt across a year. NestPriced picked that yield because it lands inside the published cluster of estimates, clear of both the high and the low extremes. At that yield, an 8 kW array produces near 9,920 kilowatt-hours across a year. Set against the 12,876 kilowatt-hours an average West Virginia home uses, that covers about 77 percent of the year’s power. A 10 kW system at the same figure makes 12,400 kilowatt-hours, about 96 percent.
Published estimates cluster between about 1,200 and 1,311 kilowatt-hours per kilowatt each year, with the model and the city moving the figure. The European PVGIS model, quoted through NumeralQ at a 20-degree tilt facing south with 14 percent losses, gives Charleston 1,247. EcoGen’s index uses 1,311 for production and 1,249 for its payback figures. A PVWatts run for Charleston’s coordinates gives about 1,219, and the same calculator gives Morgantown about 1,200, roughly 3 percent below Charleston. Two figures sit outside the cluster and are not followed: one model implies 1,053 with a heavy loss assumption, and one lead-generation site implies 1,458 with 4.7 peak sun hours that no other source supports for this state.
The shape of the year catches buyers out more than the annual total does. Winter days are short, the sun rides low over the ridges, and valley fog lingers. Summer days are long, but summer haze and afternoon thunderstorms cut into them. The winter peak sun figure of 2.47 against the summer figure of 4.12 tells the shape of the year: a summer month makes far more than a winter month, and the months when the home uses the most power, the cold months when electric heat runs hardest, are the months when the system makes the least. The quote should show monthly production figures, not just an annual total, because the monthly shape is what the bill actually sees.
Shade is West Virginia’s own production tax, and no state average captures it. A roof in an open river-bottom field near Parkersburg and a roof in a narrow hollow below a wooded ridge can sit ten miles apart and receive very different light. Trees are the usual cause: mature oaks and maples on the south side of a lot, a ridge to the southeast that delays the morning sun, a neighbor’s woodlot that was saplings when the house was built and is canopy now. EcoGen puts tree work at $500–$3,000 for a typical job, and its warning deserves repeating: if clearing the shade costs more than $3,000, or if the trees stay, the system may never reach its rated output, and the production estimate on the quote should reflect the shade that remains, not the shade the buyer hopes to clear someday.
Cold air works in a panel’s favor, which hands West Virginia one real advantage. Panel ratings assume full sun and cells at 25 degrees Celsius, close to 77 degrees Fahrenheit. Every degree of cell heat beyond the rating point cuts output by a fixed share, and the datasheet names that share the temperature coefficient. For each degree Celsius past 25, a typical modern panel gives up 0.30 to 0.35 percent of its output. July heat lifts cell temperature 20 to 25 degrees Celsius above the air on a West Virginia roof, so a hot, humid afternoon can drive cells toward 65 degrees Celsius and trim 12 to 18 percent from output. A bright January day below freezing holds the cells near the temperature they were rated at, and the panels deliver close to the power printed on the nameplate. Cold air alone never doubles output, and claims that it does mix up cell temperature with air temperature. Still, a cold, bright winter day is genuinely strong solar weather.
Snow is the honest caveat, and in the high country it is a serious one. A layer of snow on the glass shuts the sun out until it slides away or melts. The mountains average 100 inches of snow a year, among the highest totals east of the Mississippi River, and a roof at elevation in Tucker or Pocahontas County lives a different winter from a roof in the Ohio River valley. Dark, tilted panels warm in the sun, so snow on them usually slides or melts within a day or two after a storm, helped by the steep pitch of a typical mountain roof. No West Virginia-specific snow-loss percentage was verified for this guide, so none is asserted: the production figures above already carry 14 percent system losses in the PVGIS and PVWatts models, but a buyer at elevation should treat the winter months as the uncertain part of the estimate and ask the installer how the production model handles snow.
Roof direction and roof pitch move production further than most buyers expect. Every model quoted above assumes the standard case: panels facing south, tilted near the roof’s own pitch. West-facing panels make less total energy but make more of it in the late afternoon, when the household is home and using power, which matters more under an export-credit rule than under the old one-for-one rule, because power used at home is worth more than power exported. An east-facing array makes less again, and a north-facing roof slope is almost never worth covering. Production on the quote must match the roof as it stands, its real direction and its real shade, rather than the textbook south-facing case.
Net Metering in West Virginia: The Export-Credit Rules That Replaced One-for-One
West Virginia still has a net metering law, and the law still requires the big utilities to take home solar power. What changed in 2024 and 2025 is what the utilities pay for it. New customers no longer swap one kilowatt-hour sent out for one kilowatt-hour used later. They earn a fixed credit per kilowatt-hour exported, set by the Public Service Commission, the state body that regulates utilities, and the credit differs by utility. Every older guide that promises full retail net metering in West Virginia is describing a rule that closed to new customers, and every quote that still prices exports at retail is using expired law.
The statute is W. Va. Code 24-2F-8. It requires investor-owned utilities to offer net metering on a first-come, first-served basis, up to 3 percent of the prior year’s peak demand, with 0.5 percent reserved for residential customers. Home systems are capped at 25 kW, and the homeowner must carry $100,000 in general liability insurance. The legislative rule that governs the arrangements and the interconnection standards is 150 CSR 33. A Level 1 interconnection, for a system of 25 kW or less using inverter-based equipment that is UL-listed and non-islanding, carries a $30 application fee. A Level 2 interconnection, for anything that does not qualify as Level 1, costs $50 plus $1 per kilowatt of capacity.
The 3 percent cap deserves attention because it is shared. The total of all net metering arrangements and all third-party power purchase agreements together cannot exceed 3 percent of the utility’s aggregate customer peak demand in the prior year. No utility was reported to have reached the cap in the research for this guide, and no cap-closure date is asserted, but the question costs nothing: ask the utility, in writing, whether net metering is open to new customers at the address, and what happens if the cap is reached while the system is being installed. A buyer who discovers the cap after signing has discovered it too late.
The old rule survives only for the households that got in under it, and the two utility groups closed their doors on different dates. In Appalachian Power and Wheeling Power territory, homes that applied by March 1, 2026, and finished by September 1, 2026, keep the one-for-one swap until March 1, 2051. In Mon Power and Potomac Edison territory, homes that applied by December 31, 2024, and received a completion certificate by December 31, 2025, keep full retail credit for 25 years, and the rate stays with the address if the home is sold. Those grandfathered households hold a materially better deal than any new buyer can get, and their experience is not a guide to a new buyer’s payback. A neighbor’s solar story from 2024 describes a different tariff from the one a 2026 buyer signs up for.
Cooperatives and small city utilities follow different rules again. The Public Service Commission’s net metering rule covers co-ops, city utilities, and utilities with fewer than 30,000 residential customers, with systems up to 50 kW and credit at the full retail rate or at a credit the Commission approves for that utility. The 12.41-cent and 9.343-cent credits in this guide are not theirs. One secondary source claims co-ops are not subject to the mandate at all, which conflicts with the rule as EcoGen states it, and this guide does not resolve that conflict by picking a side. A buyer served by Harrison Rural Electrification Association, Craig-Botetourt Electric Cooperative, Black Diamond Power, Philippi Municipal Electric, the City of New Martinsville, or any other small utility should get the export credit, the fixed charges, and the interconnection steps in writing from that utility, because no statewide table covers them.
Two gaps in the tariffs deserve a plain statement, because both affect the bill. Neither utility group’s tariff says what happens when export credits exceed the bill in a given month, and Appalachian Power’s tariff sets no year-end rule: the credit simply stays on the bill. Whether credits carry forward indefinitely, expire, or get paid out at some point is a question for the utility in writing, before signing, not a detail to discover on the first surplus bill. The Appalachian Power tariff also states that the credit cannot reduce the monthly customer charge or a fixed minimum bill, so a portion of every bill survives even in a month when the panels cover all usage. The next section states each utility group’s credit, rates, and fixed charges as verified in November 2026.
Appalachian Power vs Mon Power: Two Credits and Two Different Paybacks
The statute sets the frame; each utility group fills in the numbers, and the numbers do not match. The table below states the export credit each group pays for power sent to the grid, with the reliability of each figure stated plainly. Export credits change only with Public Service Commission approval, but the FirstEnergy rate carries an end date, and a credit quoted on a web page in October may not be the credit on a bill in March, so every figure below carries a confirm-in-writing instruction.
| Utility group | Territory | Export credit for new homes | Status |
|---|---|---|---|
| Appalachian Power / Wheeling Power (AEP) | Charleston, Huntington, Beckley, Wheeling area; southern and central WV | 12.41 cents per kWh | Tariff N.M.S., PSC approved Aug 28, 2025; no end date |
| Mon Power / Potomac Edison (FirstEnergy) | Morgantown, Clarksburg, Fairmont, Parkersburg, Eastern Panhandle; northern WV | 9.343 cents per kWh | Net Energy Metering Rider; set through Dec 31, 2026 only |
| Co-op or city utility | Smaller service areas | Set by its own rules | Ask the utility in writing; size limit can be 50 kW |
Appalachian Power serves about 418,139 customers in West Virginia (Public Service Commission annual statistical report, year ended December 31, 2024), roughly 41 percent of the state’s homes on EcoGen’s share, which makes its rules the default West Virginia experience. Its export credit runs under Tariff N.M.S., the Net Metering Service tariff: power sent to the grid earns 12.41 cents per kilowatt-hour, credited on the bill rather than paid by check, for homes that applied after March 1, 2026, or applied earlier but missed the September 1, 2026, completion deadline. Power taken from the grid is billed at the normal rate, which EcoGen puts at 17.2 cents, so each exported kilowatt-hour earns 4.79 cents less than each kilowatt-hour bought. The tariff sets no year-end rule for the credit balance, and the credit cannot reduce the customer charge or a fixed minimum bill.
Appalachian Power’s retail rates have risen fast, and the rises are part of the solar case. A 4 percent base-rate increase took effect June 1, 2026, adding $4.84 a month on 1,000 kilowatt-hours, and the model-customer bill in Public Service Commission filings has reached $176.42 a month at 1,000 kilowatt-hours. One secondary compilation puts Appalachian Power’s customer charge at $14.02 a month; that figure is not tariff text and must be confirmed from the buyer’s own bill. Appalachian Power’s own customers use more than the state average, roughly 1,250 to 1,280 kilowatt-hours a month with an actual average bill of $216 a month as of March 2026 on Ohio River Valley Institute figures reported in the Huntington Business Journal, which is why a Charleston or Huntington home so often needs a 10 kW system or larger to cover its use. The company also filed to trim its Expanded Net Energy Cost fuel rates by $8.7 million effective September 1, 2026, a reminder that the fuel-cost portion of the bill moves in both directions.
The Appalachian Power interconnection path runs through PowerClerk, the company’s online portal. The application must be approved before installation begins, and an inspection plus a signed interconnection agreement must be in place before the system runs, with a lockable disconnect the company’s crews can reach. The 2026 Net Metering Customer Information Guide, version 2.0 effective February 1, 2026, carries the technical requirements, and the $30 Level 1 application fee and the $100,000 liability insurance requirement apply. No verified processing timeline was found for Appalachian Power residential interconnections, so none is stated: ask for the current timeline in writing when the application goes in, and do not let a crew start work on a verbal promise that approval is coming.
Mon Power serves about 397,168 customers in West Virginia (Public Service Commission, 2024), with Potomac Edison covering the Eastern Panhandle, and its rules are the tighter of the two. New home systems earn 9.343 cents per kilowatt-hour exported under the Net Energy Metering Rider, in Mon Power’s tariff P.S.C. W. Va. No. 22 and Potomac Edison’s P.S.C. W. Va. No. 3, under the settlement order the Commission approved on March 26, 2024. The rate is set only through December 31, 2026, with no successor rate on file as of the October 2026 tariff checks, so a quote that holds 9.343 cents flat for 25 years is guessing about 24 of those years. Power used at home saves 12.023 cents per kilowatt-hour in energy charges on the home rate since August 1, 2026, before small added charges, and the $6.00 monthly customer charge is also the minimum bill. Mon Power homes paid 14.50 cents a kilowatt-hour on average from September 2025 to August 2026 on EIA figures, or 13.84 cents once the $6.00 charge is removed, which is the figure the payback section uses for home-use value in Mon Power territory.
One conflict in the Mon Power figures is flagged honestly rather than smoothed over. A tariff snapshot compiled by a rate-tracking site shows an $8.00 customer charge and a 12.93-cent energy charge for a Wheeling snapshot verified October 18, 2026, against EcoGen’s tariff read of $6.00 and 12.023 cents checked September 30, 2026. The two may reflect different schedules, different dates, or a snapshot error, and this guide does not resolve the conflict from secondary sources. The buyer’s own bill and the current tariff sheet settle it, and the installer should show the savings math using the figures from the bill, not from any website.
FirstEnergy states that it has no rebate or incentive program for customer-owned systems in West Virginia, and no Appalachian Power solar rebate was found either, so the export credit is the whole of the utility help in both territories. That single fact is why the two credits matter so much: at 12.41 cents, 1,000 exported kilowatt-hours earn $124.10, and at 9.343 cents the same 1,000 earn $93.43, a $30.67 difference on every thousand kilowatt-hours sent out. Over a system’s life, the utility boundary running through the middle of the state is worth thousands of dollars, and it is decided entirely by the address. Before budgeting anything, find the company name at the top of the bill, confirm which credit applies on the date of application, and get both facts in writing.
How Long Until Solar Panels Pay for Themselves in West Virginia?
Payback in West Virginia is slow by national standards, and the reason is the combination this guide has been building toward: weak sun, high use, no incentives, and export credits below the retail price. In August 2026, the average West Virginia home paid 16.31 cents per kilowatt-hour, while homes nationally paid 18.16 cents (U.S. Energy Information Administration, Electric Power Monthly, Table 5.6.A). Across the 12 months ending in August 2026, the West Virginia average was 15.53 cents. The EIA table behind those figures is the most authoritative rate source available. West Virginia power costs about a tenth less than the national average while West Virginia homes use about a quarter more of it, so the bill is high and the value of each solar kilowatt-hour is modest.
The published payback estimates disagree, and the disagreement is instructive once each estimate’s basis is stated. EcoGen’s worth-it analysis, the most careful of the published models, puts simple payback at about 18.8 years statewide, weighted across the four big utilities, with 16.5 years at Appalachian Power, 16.4 at Wheeling Power, 20.9 at Mon Power, and 22.0 at Potomac Edison, for its 9.70 kW system at $28,421 with no incentives, no upkeep, and no price rises counted. EnergySage puts payback at 13.32 years, but its model counts electricity-price inflation and available incentives in its savings figures, so it is not a simple payback and cannot be compared directly with EcoGen’s. NumeralQ’s Charleston planning box puts simple payback at 15.2 years, but it values output at the full bill rate without stating an export-credit split, which makes it optimistic under the current rules. Two further figures are not followed at all: RenewEstimator’s 9 to 12 years, which pairs a low price with overstated sun hours, and SunMetricLab’s 12.8 years, which is computed on a net cost after the expired 30 percent credit.
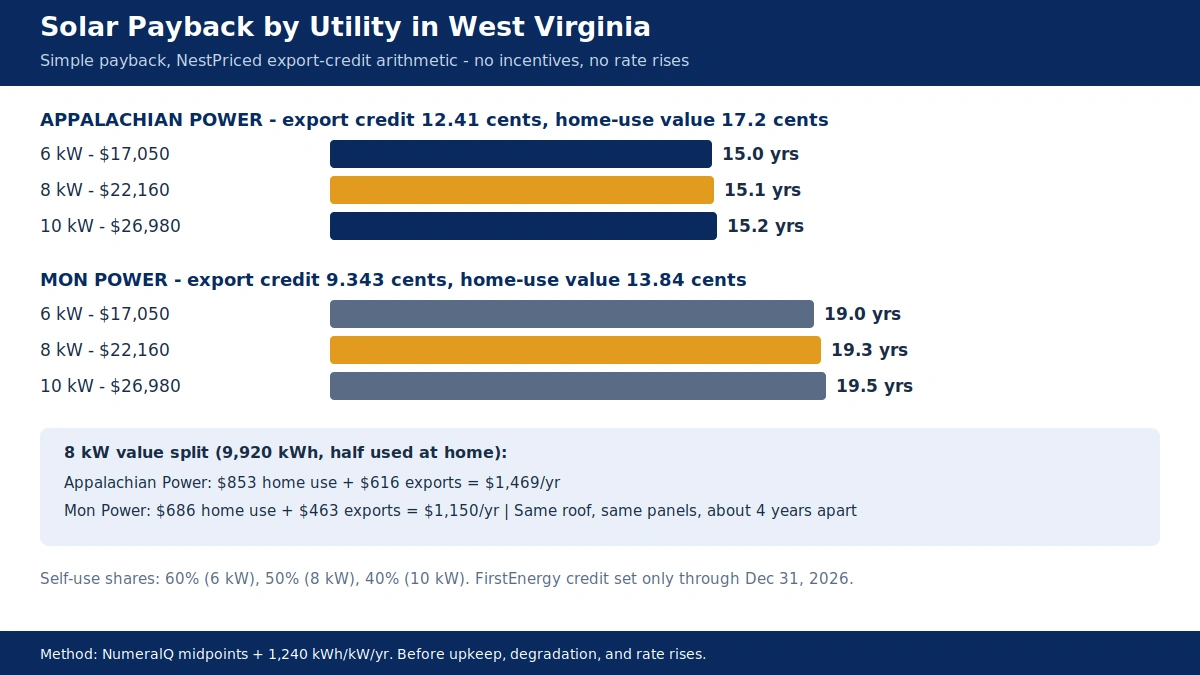
The arithmetic below is NestPriced arithmetic, built from the two export credits and a stated self-use share, and its assumptions are stated so any reader can redo it. The model uses the 1,240 kilowatt-hour planning yield, the NumeralQ midpoint costs, home-use values of 17.2 cents in Appalachian Power territory and 13.84 cents in Mon Power territory, the two export credits, and self-use shares that fall as the system grows: 60 percent of output used at home for a 6 kW system, 50 percent for 8 kW, and 40 percent for 10 kW. Savings leave the customer charge out, since the household owes it with or without panels. Upkeep, degradation, and future rate rises are excluded, and the FirstEnergy credit is held at 9.343 cents although its filed rate ends December 31, 2026.
| System | Cost (midpoint) | Yearly value, Appalachian Power | Payback, Appalachian Power | Yearly value, Mon Power | Payback, Mon Power |
|---|---|---|---|---|---|
| 6 kW | $17,050 | $1,137 | 15.0 years | $896 | 19.0 years |
| 8 kW | $22,160 | $1,469 | 15.1 years | $1,150 | 19.3 years |
| 10 kW | $26,980 | $1,776 | 15.2 years | $1,382 | 19.5 years |
Costs: NumeralQ West Virginia midpoints, October 2026. Value and payback: NestPriced export-credit arithmetic at the stated home-use values and export credits, before incentives, upkeep, degradation, and rate rises. The 8 kW Appalachian Power case, worked in full: 4,960 kWh used at home at 17.2 cents ($853) plus 4,960 kWh exported at 12.41 cents ($616) equals $1,469 a year, and $22,160 divided by $1,469 is 15.1 years. The 8 kW Mon Power case: 4,960 kWh at 13.84 cents ($686) plus 4,960 kWh at 9.343 cents ($463) equals $1,150 a year, and $22,160 divided by $1,150 is 19.3 years.
The table carries two lessons. The first is that payback barely moves with system size once the export share is counted honestly: the 10 kW system costs $4,820 more than the 8 kW system and earns only $307 more a year in Appalachian Power territory, because most of its extra generation leaves at the export credit. The second is that the utility boundary is worth about four years of payback on the same roof with the same panels: 15 years against 19. A buyer in Charleston and a buyer in Morgantown can install identical systems on identical roofs and reach payback four years apart, and neither installer did anything wrong. The tariff did it.
Three forces tug the real payback in opposite directions, and the simple model leaves all three out. Electricity rates rise: the statewide average rose 4.4 percent in the year to August 2026, Appalachian Power raised home rates 4 percent in June 2026, and Mon Power raised its energy charge in August 2026, and every future rise shortens payback for a system already paid for. Slow panel wear, typically near 0.5 percent a year, stretches payback a little further. The simple model also skips upkeep, and the big upkeep item is a possible inverter swap sometime in the second decade. A buyer who treats 15 years in Appalachian Power territory and 19 years in Mon Power territory as the planning case, with rate rises as the upside, is reading the West Virginia numbers honestly.
Stretching the view to 25 years eases the picture without rewriting it. At the modeled values held flat, an 8 kW system returns about $36,700 in bill value over 25 years in Appalachian Power territory against a $22,160 cost, and about $28,800 in Mon Power territory. Allowing roughly 6 percent for slow degradation brings those totals to about $34,500 and $27,000, still above the cost in both territories before any rate rises are counted, and rate rises at even 2 percent a year widen the margin further. EnergySage’s 25-year savings figure for its larger average system is not used here, because its own pages disagree: the West Virginia page states $57,884 while its payback-period page states $31,301 for the same system cost and payback, and this guide does not resolve that conflict by picking one. West Virginia solar pays back slowly and steadily rather than fast, and anyone who must recover the money within ten years should not buy panels for financial reasons alone.
Should You Add a Battery to Solar Panels in West Virginia?
A home battery holds daytime solar power for use after dark. In states where evening power costs far more than midday power, that shift pays the battery’s way. In West Virginia that money-making case is weak, and the honest reason is the size of the gap it can close. A battery earns only the difference between the home-use value of a kilowatt-hour and the export credit for the same kilowatt-hour. In Appalachian Power territory that gap is 4.79 cents (17.2 minus 12.41), and in Mon Power territory it is 4.50 cents (13.84 minus 9.343). Those are small gaps to pay $10,000 or more to close.
The arithmetic makes the point. The payback model in the previous section leaves an 8 kW system exporting about 4,960 kilowatt-hours a year. A battery that shifted 2,000 of those kilowatt-hours from the export credit to home use would earn the gap on each, about $96 a year in Appalachian Power territory and $90 a year in Mon Power territory, before round-trip losses. A battery returns only about 89 to 90 percent of the energy put into it, so the realistic gain falls to roughly $86 and $81 a year. Even shifting every exported kilowatt-hour, which no single home battery does in practice, would earn at most about $238 and $223 a year before losses. Against a battery costing $10,290–$15,910 installed in Charleston on NumeralQ’s model, the bill-saving payback runs to many decades, which is another way of saying the battery does not pay for itself on bill savings in West Virginia.
That does not make a battery pointless. That turns the battery into a resilience purchase, and West Virginia’s outage record gives a buyer concrete reasons to want one. Derechos, widespread straight-line windstorms, have left West Virginia customers without power for more than a week. Floods take out valley feeders. Ice storms snap lines in the high country. Islanding means the battery can cut loose from the grid and run the house alone, and a battery with that ability keeps the fridge cold, the furnace fan turning, the well pump lifting water, and the phones charged while the lines are down. A household on a well, where no power means no water, understands that value without a spreadsheet, as does a household with refrigerated medication or a home office that must stay up through a storm.
Battery prices run as follows. EnergySage marketplace data reported in September 2026 put installed battery costs across the country at $700–$1,300 per kilowatt-hour. The typical install in the first half of 2026 came to $15,647 for 13.5 kilowatt-hours, which works out to $1,159 per kilowatt-hour. EnergySage data puts the Tesla Powerwall 3, the home battery quoted most often, at an average of $13,473 installed, typically $13,000–$16,500, for 13.5 kilowatt-hours with 11.5 kW of continuous output and a built-in inverter. The Charleston planning estimate from NumeralQ puts a 10 to 13 kilowatt-hour battery add-on at $10,290–$15,910 installed, and EcoGen prices a 13.5 kilowatt-hour unit at about $15,400 installed. Those figures are consistent with each other, and any quote far above them needs a reason.
The Powerwall 3 carries a 10-year warranty holding 70 percent of its capacity. Those prices describe the product nationally, not West Virginia in particular. No West Virginia battery rebate turned up in this research: neither a utility nor a state program pays toward a home battery here, and a homeowner-owned battery placed in service in 2026 earns the same $0 federal credit as the panels. Ordering the battery with the panels folds both into a single crew visit and a single permit application, trimming some labor cost, yet no incentive attaches to either part of the job. For the national battery picture, including the alternatives to the Powerwall, see our solar battery cost guide.
Three questions settle whether a battery belongs on the job. Outage history comes first. A home that sat dark for days after a derecho or an ice storm, or one at the far end of a rural feeder where crews restore power last, has a far stronger battery case than a home on a city circuit that rarely blinks. Medical or work need comes second: refrigerated medication, a home office, a well pump, or a sump pump that cannot stop during a storm each strengthen the case. Sizing comes third. One 13.5 kilowatt-hour battery, refilled by the panels each day, runs the essentials for most of a day, while backing up the whole home through a multi-day outage takes more capacity than most buyers plan to fund.
One lower-cost route to the same outage protection is worth pricing. A portable generator, running on gasoline or propane, covers the same essentials for a fraction of a battery’s price. It needs fuel on hand, it makes noise, and it will not start itself when the power drops. When riding out the next storm is the whole goal, get a generator price first and compare it with the battery price before deciding. For a buyer who can treat silent, automatic, solar-fed backup as a comfort and safety purchase, with no expectation that it earns its price back, the battery is a fair buy, bought with eyes open.
Solar Incentives, Sales Tax, and Property Tax in West Virginia in 2026
The federal picture is simple, and it is the first thing a West Virginia buyer must absorb. A 2026 install owned by the homeowner carries no federal tax credit at all: the credit is $0. Under the One Big Beautiful Bill Act, Public Law 119-21, the residential clean energy credit under section 25D and the energy efficient home improvement credit under section 25C both ended for systems installed after December 31, 2025. The Internal Revenue Service confirmed that ending in Fact Sheet FS-2025-05. From the federal government, a 2026 homeowner-owned install receives $0. Any quote, advertisement, or savings sheet that still subtracts 30 percent for a federal credit is using expired law, and several national solar websites still do, including on their West Virginia pages.
West Virginia adds no state income tax credit for home solar. The former credit under W. Va. Code 11-13Z, capped at $2,000, expired on June 30, 2013, and does not apply to systems installed after July 1, 2013. The West Virginia Tax Division’s 2025 Tax Credit Recap Schedule lists no income tax credit for home solar. There is no state rebate, no performance payment, and no market for solar renewable energy certificates, the tradable credits that pay solar owners in some eastern states, because West Virginia repealed its Alternative and Renewable Energy Portfolio Standard in 2015 and nothing creates demand for the certificates. No state payment steps in to cover the ground the federal credit left bare. What West Virginia offers is the export credit on the electric bill, and nothing else.
The program that might have helped low-income households is closed. The U.S. Environmental Protection Agency awarded the West Virginia Office of Energy $106 million under the federal Solar for All program in 2024, to build an affordable solar program for low-income communities. On August 7, 2025, the EPA announced it was rescinding all Solar for All grants and began sending termination letters. More than 20 states sued over the cancellation in October 2025; West Virginia was not among them. No household program replaced the award as of October 2026, and there is nothing to apply for. A buyer who hears about Solar for All from an older article should treat it as closed, and a salesperson who counts it in a 2026 quote is counting money that does not exist.
Two federal rebate programs did launch in West Virginia, and both need a careful statement because neither pays for solar panels. The Home Electrification and Appliance Rebates program, called HEAR, and the Home Efficiency Rebates program, called HOMES, launched statewide on September 28, 2026, backed by $88 million in federal funding, after a pilot that ran in southern West Virginia counties from August 6, 2026. HEAR pays up to $8,000 for a heat pump, $4,000 for an electrical panel upgrade, $2,500 for wiring, $1,750 for a heat-pump water heater, and $1,600 for insulation, air sealing, and ventilation, with a $14,000 household cap, for income-qualifying households. HOMES pays for whole-home improvements tied to modeled energy savings. Under the U.S. Department of Energy’s Program Notices 26-1 and 26-2, effective May 29, 2026, HEAR pays only for electric-to-electric upgrades, never for replacing a gas, propane, or oil system with electric equipment.
The solar relevance of those programs is narrow but real. A panel upgrade funded through HEAR can still help a solar job, because the panel work is the part HEAR covers, while the panels themselves are not. A household that qualifies on income and already heats with electricity should ask a certified contractor whether the panel portion of its solar job can run through HEAR, through the state’s application portal, with approval before work starts. What no household should do is budget either program against the panel price. Some rebate trackers still list West Virginia as in development or pilot-only, and some state pages still carry pre-launch or waitlist language even after the September 2026 launch, so the live status must be confirmed on the Office of Energy’s program pages before any money is counted. Our federal energy tax credits guide walks through the federal rules in full, including what ended and what survives, and our West Virginia heat pump cost guide sets out the HEAR and HOMES details for the equipment they do cover.
Two tax questions come up on every West Virginia quote, and both need the nuance stated. On sales tax, the state rate is 6 percent and there is no exemption for solar equipment, by the consensus of every reliable source checked. On a $28,000 system, 6 percent on the equipment is $1,680 that buyers in exempt states do not pay. The nuance is labor: West Virginia does not tax labor on work that is a capital improvement, while repairs and maintenance that do not add value or extend the home’s life are taxed, under W. Va. Code 11-15-8 and Tax Division guidance TSD-310, and a full solar install is more likely to qualify as a capital improvement than a small fix. The quote must state whether sales tax is included in the headline price and how the contractor classifies the labor, because the tax treatment of the whole job turns on that classification.
On property tax, the verified position is that West Virginia has no statewide exemption for home solar. Solar is assessed at its true and actual value as a capital improvement to the property, under W. Va. Code 11-3-1. The special valuation for pollution-control facilities, which values wind projects at salvage value, has never been extended to solar: the authoritative tax analysis states plainly that legislation has not been enacted to treat solar power projects as pollution-control equipment. Marketing pages that claim a West Virginia property tax exemption for solar are contradicted by that analysis and should not be relied on. Whether the county assessor adds value for the panels varies by county, and some assessors may not raise the assessment materially in practice, but that is discretion, not law, and the buyer should ask the assessor before assuming the tax bill stays flat.
A single narrow federal route stays open, and the next section takes it up: section 48E’s commercial credit, claimed by a leasing or PPA company on a system it owns, passed on as lower payments, for systems entering service by December 31, 2027. In West Virginia that route is genuinely available, because third-party power purchase agreements are legal here, which is why the next section treats leasing and PPAs as a live option rather than a rarity. No West Virginia state loan program for home solar was found in this research, so financing means cash, a home equity line, or a solar loan from a national lender or the installer, with the loan’s all-in annual percentage rate and any dealer fee stated in writing before the monthly payment is compared with the bill saving.
Lease, PPA, or Own: How West Virginians Pay for Solar Now
In West Virginia a homeowner can choose among three ways to get solar: buy the system outright or with a loan, lease it from a solar company for a fixed monthly payment, or sign a power purchase agreement and buy the power it makes at a contract rate. The second and third options are legal here, which sets West Virginia apart from several neighboring states, and the law that made them legal is recent enough that many national guides still miss it. House Bill 3310, passed April 9, 2021, and codified at W. Va. Code 24-2-1, excepted on-site solar facilities from the definition of a public utility when the facility sits on the customer’s premises, is designed to meet only that premises’ needs, and sells its output under a power purchase agreement. Senate Bill 544 raised the residential size cap from 25 kW to 50 kW in 2023. The customer must notify the utility before entering an agreement, the contract must be printed in 11-point type or larger, and the aggregate of all PPA and net metering arrangements counts against the same 3 percent cap described in the net metering section.
The federal lease route is the reason these options matter more in 2026 than they did before. The commercial clean electricity credit under section 48E belongs to the company that owns the system, whether it leases the system out or sells the power under a PPA, and the company can pass that value to the homeowner as lower payments when the system enters service by December 31, 2027. No other federal help remains for any kind of 2026 home solar install, and that framing holds for the whole year. The homeowner does not claim the credit and cannot verify it from the contract paperwork alone, so the pass-through must be visible in the payment itself: a lease or PPA payment that is not clearly below the utility rate it replaces is not passing anything through.
Solar Holler, the West Virginia-based installer best known for its school and public-sector PPAs, is the company most often named in connection with West Virginia third-party solar. Its published PPA terms state $0 upfront cost, power priced typically 10 to 20 percent below the rate the customer currently pays the utility, and a buyout option after 6 years at fair market value set by a third-party evaluator. Those terms were verified on the company’s business PPA page, which covers businesses, churches, schools, and nonprofits, and no separate residential PPA rate schedule was found, so the 10 to 20 percent figure is attributed here to the business page and must be confirmed for a home contract in writing. The company’s school work is real and large: 15 Wayne County schools under a PPA, with six of the systems finished and nine still being built in early 2026, and expected savings of $150,000–$200,000 a year for the district. School economics are not home economics, and the district’s savings do not predict a household’s.
EnergySage’s marketplace estimates give a rough shape to the residential offers, with thin data behind them. For its 12.14 kW average system, it estimates a power purchase agreement at about $146 a month from one installer, using national quote data, with a rate of $0.11–$0.23 per kilowatt-hour and an escalator of 0 to 3 percent a year, and a lease at about $159 a month from West Virginia quotes, with a 1 percent annual escalator. A loan on the same system runs about $275 a month in its estimates. Those are marketplace estimates built on one to three installers, not published price lists, and they are stated here only to show the order of magnitude. Any real offer needs its own numbers, in writing, on the contract’s own pages.
Ownership, by contrast, is straightforward and is what most West Virginia solar homes do. The buyer pays the installed price, owns the equipment, claims the export credit on the utility bill, and keeps whatever bill value the system produces. Upkeep, the risk of an inverter replacement, and the roof itself all stay with the buyer. Either the roof must outlast the panels, or the budget must carry the cost of removing and reinstalling them when the roof is replaced, $3,000–$6,000 on EcoGen’s range. No West Virginia-specific detach and reset price from a West Virginia installer was verified for this guide, so that range is the only figure stated, and the quote for a roof near the end of its life should include that line. National figures for taking panels off and putting them back sit in our solar panel removal and reinstall cost guide.
A loan splits the difference between paying cash and signing a third-party contract without giving up ownership. Borrowing leaves the equipment, the ownership, and the export credit in the homeowner’s name, and the loan payment lines up month by month against the bill saving for a direct comparison. The comparison must be honest about two things: the loan term, because a 10-year loan against a 15- to 19-year payback means the household pays more than it saves for the first decade and banks the benefit later, and the dealer fee, because a loan carrying a hidden dealer fee raises the effective price by thousands and adds years to the payback. Judge every financed offer on the cash price and the all-in annual percentage rate, never on the monthly payment alone.
Homeowners association rules are a separate West Virginia question with a genuinely helpful answer. State law at W. Va. Code 36-4-19 makes unenforceable any covenant or rule in governing documents executed or recorded after June 8, 2012, that effectively prohibits or restricts the installation of solar energy systems. Associations may still impose reasonable restrictions, such as rules for historic preservation, restrict solar in common areas, and change their rules by a vote of members, and older covenants recorded before June 8, 2012, still apply. A buyer in a covenanted subdivision should still get the association’s position in writing before signing an installer contract, because a reasonable restriction can still dictate placement and appearance, and the buyer, not the installer, bears the cost of moving panels the association rejects.
The decision rule is short. Buy, with cash or a fairly priced loan, if the home will be kept for at least 15 years, the roof has at least 15 years of life, and the utility’s export credit is confirmed in writing. Consider a lease or PPA if the upfront cost is the barrier and the contract prices power clearly below the utility rate with a stated escalator, a stated buyout, stated transfer terms on sale, and a written statement of who keeps the export credits. Do not sign any third-party contract without reading the escalator clause twice: at 3 percent a year, the rate after 20 years is roughly 80 percent above the opening rate, and a PPA that starts 15 percent below the utility rate can end above it. A promise of free panels is no substitute for the ownership arithmetic in the payback section, which is the only arithmetic this guide could verify end to end for a West Virginia home.
Floods, Wind, Hail, and Heavy Snow: Weather-Proofing a West Virginia System
West Virginia weather tests a solar system differently from the weather in the Plains states. Hail matters, but flooding matters more, wind matters every spring, and snow in the high country matters all winter. A buyer here should choose equipment and placement with all four in front of them, not just the hail rating on the panel datasheet.
Flooding is the costliest and most severe natural hazard in West Virginia, according to the state climate summary, and the National Weather Service office in Charleston calls it the biggest overall weather threat in its region. About 7.4 percent of the state’s primary buildings, 82,408 of 1,118,761, sit in the 1 percent annual-chance floodplain, and 8,237 of those sit in floodways, with 64 federally declared flood disasters between 1953 and 2024. Flash floods on small streams can sweep buildings away, including outside mapped flood zones, and in steep valleys they can arrive with little warning. Roof panels themselves sit above floodwater, but inverters, disconnects, batteries, and any ground-mounted equipment do not. A system on a home in or near a floodplain should place every piece of ground-level equipment above the expected water line, and the installer should say in writing where each component sits and why. A battery mounted low in a flood-prone basement is a liability, not resilience.
Wind is the second test, and it arrives as thunderstorms rather than hurricanes. Damaging wind reports came on 45 days a year on average within 124 nautical miles of the Charleston radar between 1980 and 2006, and Kanawha County alone logged 163 thunderstorm wind reports at 58 mph or higher between 2016 and 2025. Derechos, the widespread straight-line windstorms that flattened power lines across the state in 2012 and have returned since, have left customers without power for more than a week. Racking and the fixing into the roof structure count as much as the panel’s own rating. A panel can ride out the wind and still fail if its mount tears free of rotted decking. Ask the installer to name the racking system, the attachment method, and the design wind speed the job is engineered for. Before any racking goes up, confirm the roof decking underneath it is sound. No West Virginia design wind speed figure was verified for this guide, so none is stated, and the engineering stamp for the specific address is the document that settles it.
Hail is the third test, and the evidence is reassuring with one important qualification about glass thickness. Under the baseline certifications, UL 61730 and IEC 61215, testers fire 1-inch ice balls at about 50 mph into 11 points on the panel. To pass, the panel must show no visible cracking or delamination and must lose no more than 5 percent of its power. The field evidence most often cited is a 2017 hailstorm the National Renewable Energy Laboratory studied: stones up to 2.75 inches damaged just 1 panel out of 3,168, a survival rate of 99.97 percent. According to the Department of Energy, hail needs to reach roughly golf-ball size, near 1.75 inches, before it generally damages panels. NOAA logged 35 reports of hail 2 inches or wider in West Virginia in the ten years from 2016 to 2025, and Huntington recorded hail up to 3.0 inches within 15 miles of the city since 2010, though most hailstones are 1 inch or smaller.
The qualification is the glass. One ice-ball test using 45 mm balls broke 97 percent of panels carrying 2 mm glass, while only 13 percent of panels with 3.2 mm glass failed. A gap that wide turns glass thickness and hail rating into written questions for every bidder. Prefer panels tested to FM 4473 up to Class 4, which covers hail nearing 2 inches, or panels whose maker publishes test results past the 1-inch baseline. The test details and the field evidence sit in EnergySage’s hail durability guide, updated August 10, 2026. It also reports that some installers blame hail for more than half of insured solar losses, which puts the insurance question on the same level as the panel choice.
Snow is the fourth test, and it splits the state in two. The mountains average 100 inches a year, and a roof at elevation carries snow loads a valley roof never sees. Panels add weight and change how snow drifts and slides, and the structural check on an older roof should account for the combined load, including drifting against ridges and valleys. No West Virginia snow-load figure in pounds per square foot was verified for this guide, so none is stated, and the local Authority Having Jurisdiction sets the load the racking must meet. Higher-elevation roofs need racking engineered to the local snow and wind code, through that authority, at a cost above standard rails, and the quote should name the engineering rather than assume it.
Insurance is where West Virginia buyers most often get caught. No West Virginia-specific figure for the premium effect of adding solar was verified, so none is stated, and no statewide average premium is asserted here. Get the insurer’s answers in writing before installation day: are the panels covered under the dwelling policy, at replacement cost or at actual cash value, what dollar deductible applies to wind and hail, and does the policy exclude cosmetic damage? The last question matters because hail can mark a panel’s surface without stopping it from producing power. Flood coverage is a separate question: a standard homeowners policy does not cover flood, and a home in or near a floodplain needs that conversation separately, before the system goes on rather than after the first high water. Sort out the insurance before storm season opens, not after the first hailstones fall.
Permits, Licenses, and Interconnection in West Virginia
West Virginia has no solar-specific license, which means the licenses that matter are the contractor license and the electrician license, and a buyer needs to check both. The Contractor Licensing Board license, under W. Va. Code chapter 30, article 42 and administered with the West Virginia Division of Labor, is required for residential work of $5,000 or more, with classes including Electrical, Residential, General Building, and Specialty. Every home solar job in this guide costs more than $5,000, so every installer needs one. The license can be checked in the Board’s contractor search, and the name on the license must match the name on the contract, including any trade name the company uses.
Separately, electrical work for hire, including wiring a solar system into the service panel, needs a license issued by the State Fire Marshal, under W. Va. Code 29-3B-2. The panels themselves can be mounted by workers without an electrician’s license, but the final electrical connection cannot. One set of older city guides states that the electrician’s license comes from the Division of Labor; the statute and the more recent tariff-era guidance point to the State Fire Marshal, and this guide follows the statute. Either way, the buyer’s question is the same: name the licensed electrician who will make the connection, and show the license. An installer who cannot name that person should not be on the roof, however polished the sales presentation.
Permits come from two directions, and the order matters: the city or county first, then the utility. The city or county building department issues the building or electrical permit, and the system stays off until the utility’s interconnection approval lands. NumeralQ lists the solar permit fee as not published for Charleston, and no separate solar permit fee schedule was verified for any West Virginia city, so the quote must state the permit fees or state that they are included. There is no expedited-solar permit law in West Virginia, so the local Authority Having Jurisdiction handles permits on its own timeline, and soft costs vary from city to city. A contractor who suggests skipping the permit is suggesting the buyer give up the inspection that would catch a bad install, and the paper trail that would matter if the system fails in year two.
The utility half of the paper trail differs by company and must be followed in order. Appalachian Power requires an approved application through its PowerClerk portal before installation, then an inspection and a signed interconnection agreement before the system runs. Mon Power and Potomac Edison run applications through FirstEnergy’s online portal, with a $30 Level 1 application fee. Both groups require the $100,000 liability insurance, and both require company approval before the generator connects to the distribution system. Installing before approval risks the interconnection, and a buyer should confirm the approval arrived before the crew arrives. No verified processing timeline was found at either utility, so the buyer should ask for the current timeline in writing when the application goes in and should not accept a verbal estimate of days as a commitment.
Two protections in West Virginia law should sit at the center of the contract conversation. The first is the lien law: under W. Va. Code 38-2-21(b), on an existing owner-occupied single-family home, the owner has a defense against a subcontractor or supplier lien if the owner owes the contractor nothing, or less than the amount claimed. Subcontractors and suppliers must notify the owner within 100 days, and the owner may demand an itemized account, which is due within 10 days, under section 38-2-19. The panel and inverter distributor and any electrician the installer subcontracts are the likely lien claimants on a solar job. The statute points to plain habits: hold back full payment until the system is inspected and running, tie each payment to a written milestone, and file the contract, the permit, the inspection sign-off, and the utility approval together.
Five checks settle whether an installer is fit for the job, and none of them is optional. Confirm the Contractor Licensing Board license and its classes, confirm the State Fire Marshal licensed electrician by name, confirm the liability and workers’ compensation certificates are current, confirm the installer has run interconnection paperwork with the buyer’s own utility, Appalachian Power’s PowerClerk or FirstEnergy’s portal, and confirm three recent West Virginia installs with addresses the buyer can drive past. An installer who cannot produce those five should not be on the roof. With only a handful of installers active in the state on the marketplace counts, the check matters more, not less: a thin market rewards the buyer who verifies and punishes the buyer who trusts a brochure.
Getting Solar Quotes in West Virginia: Checklist and Decision Rules
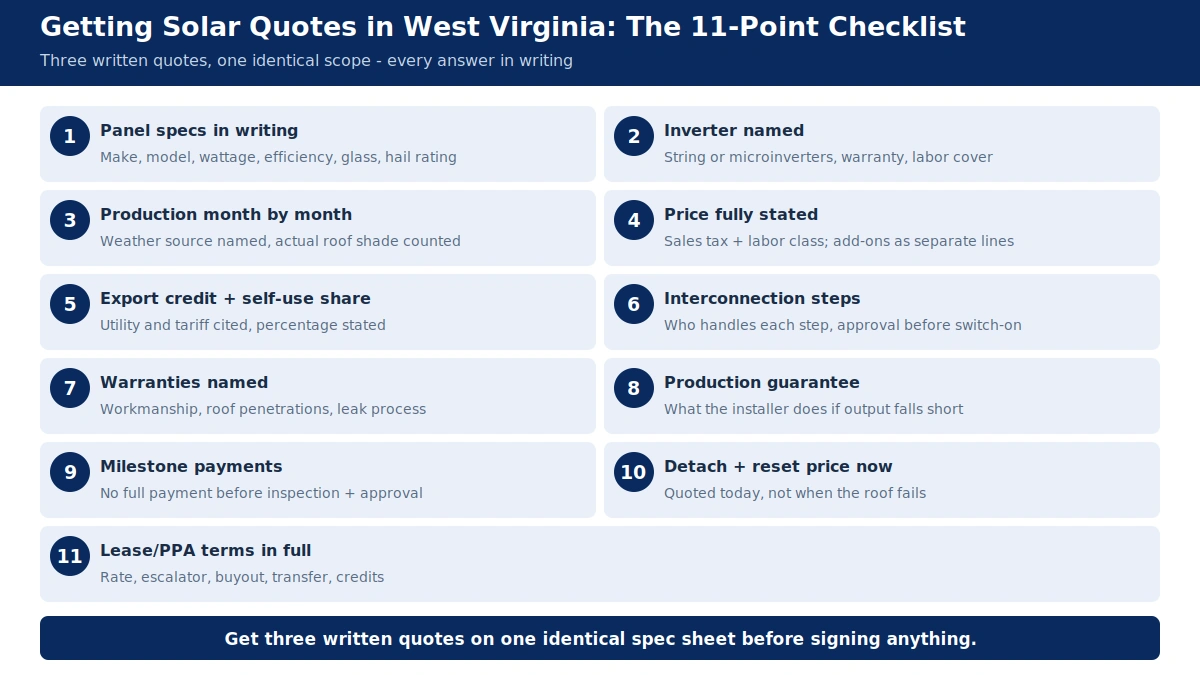
Bids that price different jobs cannot be compared, so the checklist below pins every bidder to one identical scope, one identical set of assumptions, and one identical list of written answers. Line up three written quotes from licensed installers, each covering the same system size, the same class of panel model, and the same roof scope, and hold every bidder to written answers on each checklist item. Verbal answers, and quotes that collapse everything into one monthly payment, both hide the side-by-side comparison a buyer needs before signing. In a state with only a few active installers, three quotes may take patience; take it anyway, because the second and third quotes are what reveal the first quote’s assumptions.
- Panel make, model, wattage, efficiency, temperature coefficient, glass thickness, and hail rating, in writing
- Inverter type, string or microinverters, make and model, warranty length, and whether the warranty covers labor
- Year-one production estimate in kilowatt-hours, shown month by month, with the weather data source named and the shade on the actual roof counted
- Total installed price with sales tax stated as included or excluded, the labor classification stated, and every add-on as a separate line: panel upgrade, roof work, battery, tree work, permit fees, interconnection fee
- The export credit and the retail rates the savings math assumes, with the utility name and the tariff or rider cited, and the self-use share stated as a percentage
- The interconnection steps and who handles each one, including the portal application, the inspection, and the approval before switch-on
- The workmanship warranty length and what it covers, the roof penetration warranty, and the process if a leak appears under the array
- The production guarantee, if any, and what the installer pays or does if the system underproduces
- The payment schedule tied to milestones, with no full payment before inspection and utility approval
- The removal and reinstallation price if the roof needs replacing during the panel warranty period, quoted now, not later
- For a lease or PPA: the opening rate, the annual escalator, the buyout terms, the transfer terms on sale, and who keeps the export credits, all in writing
The decision rules follow from everything above, and they are stated as rules because West Virginia punishes vague intentions. Rule one: size to the bill, and bias toward using power at home. An 8 kW system fits many West Virginia homes; a 6 kW system fits a smaller home and wastes little to the export credit; a 10 kW system needs a load to justify it, such as an electric vehicle or a heat pump, and the extra panels should not be bought for the lower per-watt price alone. Rule two: hold the utility’s terms in writing before any signature. Four facts decide payback: the export credit, the fixed charges, the interconnection steps, and whether net metering still admits new customers at the address. All four come from the utility, and none of them comes from the installer.
Rule three: build the budget on money that exists, and on nothing else. There is no federal credit, no state credit, no state rebate, and no Solar for All money for a 2026 West Virginia solar install, and a budget built on any of them is a budget built on hope. The only help that may touch the job is HEAR money for a panel upgrade, for a household that qualifies and already heats with electricity, confirmed through the state’s portal before work starts. Rule four: fix the roof first. With panels rated for 25 years or more, a roof holding only five years of life promises a removal and reinstallation bill right in the middle of the payback period. Where the roof is due for replacement, price roof and panels as one job, put the roof work first in the sequence, and get the installer’s warranty on the roof penetrations in writing.
Rule five: judge the battery on outage protection alone, and never as a way to earn money back. In West Virginia’s export-credit market, a battery earns roughly $81–$96 a year in extra bill value on the modeled 8 kW system, and it should be bought for outage protection with open eyes, or not bought at all. Rule six: read any lease or PPA as a 20-year rate contract, not as free panels. The escalator, the buyout, the transfer terms, and the export-credit assignment decide whether the contract helps or hurts, and all four must be in writing before any deposit.
Rule seven: weigh solar against what the same money buys in efficiency work. A heat pump, insulation, and air sealing can cut the bill for less money and with a shorter payback, especially in a home that still heats with electric resistance, and a home that has not yet done the cheap efficiency work should price it before pricing panels. Our heat pump versus solar guide compares the two investments directly, and our West Virginia heat pump cost guide prices the heat pump side for this state. Solar is the right answer for a home with a sound roof, open southern sky, a confirmed utility deal, and a 15-year horizon. A home missing any one of those four is better served by efficiency work now and panels later, and reaching that conclusion is a good outcome, not a failed sale.
Sources & methodology
Cost sources: NumeralQ West Virginia and Charleston solar cost pages, estimator pricing October 26, 2026 (planning estimates, not bids; EnergySage and SolarReviews data retrieved October 26, 2026; model v2); EnergySage West Virginia solar panel cost page, updated November 6, 2026 (marketplace quote data); EcoGen America Solar Cost Index, September 2026 edition, prices September 25, 2026; SolarReviews West Virginia and national cost pages, November 2026 (gross figures only; after-credit columns use the expired credit); ElectricChoice, updated October 25, 2026; RenewEstimator (low outlier, labeled); SunMetricLab, September 10, 2026 (gross figures only); Berkeley Lab national range via roofpayback (2024 installs, different basis, noted not followed).
Production sources: NREL PVWatts version 8 via roofpayback (Morgantown, retrieved October 11, 2026) and via homeenergycost.com (Charleston coordinates, south-facing, 20 degrees); PVGIS via NumeralQ (20-degree tilt, south-facing, 14 percent losses); EcoGen peak sun hours (NREL PVWatts); Fire Mountain Solar insolation table (NREL source); TheGreenWatt PVWatts v8 state table, April 2026; SparkPowered (EIA and NASA data); temperature coefficient ranges from published panel specifications.
Rate and utility sources: U.S. Energy Information Administration, Electric Power Monthly, Table 5.6.A, August 2026, and Table 5.6.B, January to August 2026; EIA Form EIA-861 2025 final data, Average Monthly Bill workbook (released October 7, 2026); EcoGen West Virginia cost, incentives, worth-it, companies, and free-solar pages, checked September 29 to October 30, 2026 (tariff reads: Appalachian Power Tariff N.M.S.; Mon Power tariff P.S.C. W. Va. No. 22, Net Energy Metering Rider and Schedule A; Potomac Edison tariff P.S.C. W. Va. No. 3); Appalachian Power West Virginia Net Metering Customer Information Guide, version 2.0, effective February 1, 2026; Public Service Commission of West Virginia Annual Statistical Report, year ended December 31, 2024; Huntington Business Journal, July 2026 (model-customer bill, Ohio River Valley Institute average bill, secondary source); costperkwh utility estimates (secondary); solarpanelscost.com West Virginia guide, reviewed November 5, 2026 (cross-check).
Law and program sources: W. Va. Code 24-2F-8 (net metering); 150 CSR 33 (net metering and interconnection rule); W. Va. Code 24-2-1 and 24-1-1c (HB 3310 of 2021, power purchase agreements) and SB 544 of 2023 (50 kW residential cap); W. Va. Code 36-4-19 (solar energy covenants); W. Va. Code 11-13Z-3 (former solar tax credit, expired 2013); W. Va. Code 11-15-8 and Tax Division TSD-310 (sales tax, capital improvement labor); W. Va. Code 11-3-1 (property assessment) and 11-6A-5a (pollution-control valuation; solar not covered, per Frost Brown Todd analysis, May 2023); W. Va. Code chapter 30, article 42 (Contractor Licensing Board) and 29-3B-2 (State Fire Marshal electrician licensing); W. Va. Code 38-2-19 and 38-2-21(b) (lien law); One Big Beautiful Bill Act, Public Law 119-21, and IRS Fact Sheet FS-2025-05; U.S. Department of Energy HEAR/HOMES Program Notices 26-1 and 26-2, effective May 29, 2026; West Virginia Office of Energy HEAR/HOMES statewide launch, September 28, 2026; U.S. Environmental Protection Agency Solar for All rescission, August 7, 2025, and Charleston Gazette-Mail, December 31, 2025 (lawsuit, West Virginia not a party).
Weather and insurance sources: NOAA storm reports via NumeralQ (Kanawha County wind, statewide hail, 2016 to 2025); Cloudbreak hail history (NOAA Storm Prediction Center data through November 11, 2026) and state climate summary (flooding, snow); National Weather Service Charleston (flood threat, wind, hail size); EnergySage hail durability guide, updated August 10, 2026; National Renewable Energy Laboratory 2017 hailstorm study; U.S. Department of Energy hail guidance; FM 4473 and UL 61730/IEC 61215 test standards; Cotality weather-loss ranking via The Cooldown, November 8, 2026 (secondary reporting of a proprietary ranking).
Battery sources: EnergySage marketplace data via jouleio, September 17, 2026, and via art 178 research; Tesla Powerwall 3 specifications and EnergySage and SolarReviews pricing; NumeralQ Charleston battery add-on estimate, October 2026; EcoGen battery pricing ($1,140 per kWh installed).
Methodology: production at the NestPriced planning figure of 1,240 kilowatt-hours per kilowatt per year, chosen inside the published cluster of about 1,200 to 1,311. Coverage against 12,876 kilowatt-hours average annual use (1,073 a month, EIA-861 2025 final). Payback arithmetic is NestPriced export-credit arithmetic at the stated home-use values, export credits, and self-use shares, stated in the payback section. Battery arbitrage arithmetic is NestPriced arithmetic at the stated cent gaps on 2,000 shifted kilowatt-hours with a 10 percent round-trip loss. All planning estimates, secondary compilations, and unresolved conflicts are flagged in the text where they appear. Figures that could not be verified are listed in the QC log and are not asserted in the body.
Disclaimer: Prices, rates, credits, and program rules change, and utility export credits, fixed charges, and interconnection timelines must be confirmed in writing with the utility before signing. This guide states planning estimates and published figures with their sources and dates, and it is not a quote, a tax opinion, or legal advice. Get three written quotes from licensed installers, confirm the roof condition, the shade, and the utility terms, and confirm insurance coverage before the panels go on.
How much do solar panels cost in West Virginia in 2026?
An 8 kW rooftop system costs $19,210–$25,110 installed in West Virginia in 2026, or $2.40–$3.14 per watt, on NumeralQ planning estimates dated October 26, 2026. EnergySage marketplace data puts West Virginia at $2.88 per watt and EcoGen’s September 2026 index at $2.93 per watt, both inside the NumeralQ band. The final price depends on roof complexity, shade, equipment choice, and any panel or roof work the job needs.
Does West Virginia still have net metering in 2026?
Yes, in a reduced form. State law at W. Va. Code 24-2F-8 still requires the big utilities to offer net metering for home systems up to 25 kW, but new customers earn a fixed credit per kilowatt-hour exported instead of a one-for-one swap: 12.41 cents at Appalachian Power and Wheeling Power, and 9.343 cents at Mon Power and Potomac Edison. The older one-for-one rule is closed to new homes at all four companies, and the FirstEnergy credit is set only through December 31, 2026.
What does Appalachian Power pay for extra solar power?
Appalachian Power credits 12.41 cents per kilowatt-hour for power a new home system sends to the grid, under Tariff N.M.S. approved by the Public Service Commission on August 28, 2025, for homes that applied after March 1, 2026, or missed the September 1, 2026, completion deadline. Power taken from the grid is billed at the normal rate, about 17.2 cents on EcoGen’s figure. Homes that applied by March 1, 2026, and finished by September 1, 2026, keep the one-for-one swap until March 1, 2051.
What does Mon Power pay for extra solar power?
Mon Power credits 9.343 cents per kilowatt-hour for power a new home system sends to the grid, under its Net Energy Metering Rider, for homes that applied after December 31, 2024, or were not finished by December 31, 2025. The rate is set only through December 31, 2026, with no successor rate on file, so confirm the current rate in writing before signing. Power used at home saves 12.023 cents per kilowatt-hour in energy charges on the home rate since August 1, 2026, and the $6.00 monthly customer charge is also the minimum bill.
How long is the solar payback in West Virginia?
Simple payback runs about 15 years in Appalachian Power territory and about 19 years in Mon Power territory for an 8 kW system at the NumeralQ midpoint cost, on NestPriced export-credit arithmetic with half the output used at home. EcoGen’s published model puts payback at 16.5 years at Appalachian Power and 20.9 years at Mon Power for its larger typical system. The utility boundary is worth about four years of payback on the same roof, and future rate rises shorten payback while upkeep and slow panel wear lengthen it.
Is there a federal tax credit for solar panels in West Virginia in 2026?
No. A homeowner-owned system placed in service in 2026 earns a $0 federal credit, because the One Big Beautiful Bill Act ended the residential clean energy credit for installs after December 31, 2025. West Virginia has no state income tax credit for home solar either, and its $106 million Solar for All award was canceled in August 2025 before any household was served. The only federal help left runs through a lease or power purchase agreement, where the system owner may claim the commercial section 48E credit through 2027 and pass the value through as lower payments.
Can I lease solar panels or sign a PPA in West Virginia?
Yes. Third-party power purchase agreements have been legal in West Virginia since April 9, 2021, under House Bill 3310, with a residential size cap of 50 kW since 2023, and the system must be sized to the home’s own needs. Solar Holler’s published PPA terms price power typically 10 to 20 percent below the utility rate with $0 upfront, verified on its business page, so confirm the residential rate, the annual escalator, the buyout terms, and who keeps the export credits in writing before signing. Ownership remains the common route, and any third-party contract should be read as a long-term rate contract.
Should I add a battery to solar panels in West Virginia?
Buy a battery for outage protection, not for bill savings. The gap between home-use value and the export credit is under 5 cents per kilowatt-hour at both utility groups, so a battery shifting 2,000 kilowatt-hours a year earns only about $81–$96 in extra bill value on NestPriced arithmetic after round-trip losses. A 10 to 13 kilowatt-hour battery costs $10,290–$15,910 installed on Charleston planning estimates, with no state or utility battery rebate found. A battery makes sense for well pumps, medical needs, and homes at the end of rural feeders that lose power for days.