


Solar panels in Kentucky cost $2.65 a watt in 2026. Kentucky is the cheapest solar market in its neighborhood and the cheapest electricity market in its neighborhood. That pairing is the whole story.
The panels are cheap because crews are cheap, roofs are mostly simple asphalt shingle, and installers compete hard across Louisville and Lexington. The electricity is cheap because coal still generates about two-thirds of it.
A kilowatt-hour a Kentucky panel makes at home is worth about 13.8 cents, the statewide residential average. A kilowatt-hour it sends to the grid is worth 7.089 cents on LG&E and 7.534 cents on KU. The gap between those two numbers is the gap between a system that pays back in the mid-teens and one that takes close to twenty years.
The household’s own habits decide which side of the gap it lands on.
The problem here is arithmetic: low prices on both sides of the meter, a federal credit that ended on December 31, 2025, and no state program standing behind the buyer. The Kentucky Home Energy Rebates program holds $134 million in federal money and is not yet accepting applications.
There is no state tax credit. There is no state rebate.
What Kentucky does have is a net-metering law that covers systems up to 45 kW, a regulator that set the export rates in writing, and rates that the Public Service Commission kept in place in February 2026 with new base rates barred before August 1, 2028. That is unusual planning visibility, and it is worth more than it sounds like.
Table of Contents
How Much Do Solar Panels Cost in Kentucky in 2026?
Start with the number used everywhere else, and the reason it is the number. EcoGen’s September 2026 Solar Cost Index puts Kentucky at $2.65 per watt installed, cash, before incentives.
That is the seventh-lowest price of 51 jurisdictions, below the $2.89 national figure, and cheaper than every state Kentucky touches: Missouri $2.74, Ohio $2.77, West Virginia $2.93, Indiana $2.97, Tennessee $3.18. Missouri, the closest of those neighbors on price, runs $2.74 a watt. Our Missouri solar cost guide prices the same system sizes on the other side of the Mississippi.
The typical Kentucky system, the median size homeowners actually installed in 2025, counted by Berkeley Lab across 398 systems, is 7.77 kW, which prices at $20,591 before incentives. Most 2026 quotes landed within 12% of that anchor on either side, roughly $2.33 to $2.97 per watt.
Inside that band, a 6 kW system lands between $14,000 and $17,800, an 8 kW system between $18,600 and $23,800, a 10 kW system between $23,300 and $29,700, and a 12 kW system between $28,000 and $35,600.
EnergySage, reading its own marketplace in October 2026, puts Kentucky lower: $2.48 a watt, with a 7 kW system at about $17,360 and a 14.68 kW system at $30,975 to $41,907, or $2.11 to $2.85 a watt. Seventeen cents separate the two anchors.
Read the size gap first. EnergySage’s marketplace average describes the shoppers who come to it, and Kentucky shoppers who come to a marketplace skew toward bigger systems.
Berkeley Lab’s 7.77 kW median describes what Kentuckians actually bolt to their roofs. The median is the typical size here, and EcoGen’s $2.65 is the headline because it is built on that median.
Two more measures sit on either side. The November 2026 SolarReviews figure, $2.75 a watt and about $21,173 on a 7.3 kW average system, comes from a national model built on NREL, EIA, and Bureau of Labor Statistics inputs, not from Kentucky quotes. It counts as a model, not a market price.
A planning estimate from SolarEnergyPrices puts the state at $2.80 a watt, range $2.55 to $3.05, with a 10 kW system at $25,500 to $30,500. ConsumerAffairs, updated in August 2026, reports $2.54 a watt, with a 5 kW system at $12,700 and a 10 kW system at $25,400.
All five measures land between $2.48 and $2.80. The spread is narrow, and it says the headline is not a guess: Kentucky installs are genuinely cheap.
The real argument is not about the price of the panels. It is about the price of the power they replace.
One caution belongs before the tables, because the typical size shapes every figure that follows. That 7.77 kW is a median of real 2025 installs, not a modeled size. It still falls short of the average Kentucky household’s yearly use.
At Kentucky’s rate of about 1,382 kilowatt-hours per kilowatt, the typical 7.77 kW array produces roughly 10,738 kilowatt-hours each year. The average Kentucky home draws roughly 12,564 a year, about 1,047 a month. In plain terms, the typical array makes about 85% of the electricity the average Kentucky household uses in a year.
An average-use home could take more than that array gives. It matters because a system that covers 85% of use leaves less power to export at 7 cents, and more of its value arrives as power used at home at the full retail rate. The sizing section further down unpacks what that gap means for a home that does not use the state average.
That per-watt figure already carries the whole job:
- Panels, inverter or microinverters, racking, and wiring
- The crew’s time, permits, inspection, and the filing with the utility
Five extras sit outside that number:
- A new roof
- A panel upgrade
- Tree work
- A battery
- A trench out to a detached garage
No incentive is baked into that arithmetic, because a Kentucky buyer in 2026 has none to bake in: the federal credit ended, the state offers no rebate, and the state has no income-tax credit for solar. The exceptions are narrow and utility-specific, and the incentives section below prices them separately, so the headline stays true for everyone else.
For most Kentucky buyers, the sticker on the quote is the price of the system, with nothing left to subtract. A quote that subtracts anything beyond that is doing its math under a law that stopped applying on December 31, 2025.
A caution before the tables: the cheapest quote in Kentucky is rarely the cheapest system once the job is done, and the gap between the cheapest and dearest bids in the state is wide enough to matter. Dealer fees of 20 to 30% of the cash price are often folded into the amount a $0-down loan finances, and the fee is invisible until the cash price sits next to the financed price.
With quotes from Louisville, Lexington, and northern Kentucky installers spread across the table, the cash price per watt for the same panels on the same Kentucky roof is the one number that lets you judge bidder against bidder. Get that per-watt figure from three installers in writing, and walk away from any bidder who will not put it on paper.
Where the export rate on the bill decides the payback, as it does here, that third quote also proves whether the company priced your utility’s tariff or just the Kentucky average.
| Source | $ per watt | System | Cash total | Payback |
|---|---|---|---|---|
| EcoGen Index (Sep 2026) | $2.65 | 7.77 kW | ~$20,591 | ~17–20 yrs, illustrative |
| EnergySage (Oct 2026) | $2.48 | 7 kW avg | ~$17,360 | Not published |
| EnergySage (Oct 2026) | $2.11–$2.85 | 14.68 kW avg | ~$30,975–$41,907 | Not published |
| SolarReviews (Nov 2026) | $2.75 | 7.3 kW avg | ~$21,173 | Not published |
| SolarEnergyPrices (2026) | $2.80 | 10 kW | ~$28,000 | Not published |
| ConsumerAffairs (Aug 2026) | $2.54 | 10 kW | ~$25,400 | Not published |
| National range (article 4) | $2.25–$3.30 | 8.2 kW | ~$24,600 at $3.00/W | 6–12 yrs |
The notes under that table matter. Three of its rows carry a warning label. The $2.75 SolarReviews figure and the $2.80 SolarEnergyPrices figure come from a national model and a planning estimate, not from Kentucky quotes, so neither sets the headline here.
EnergySage’s $2.48 is a marketplace average on bigger systems, and it audits the headline from below rather than replacing it. ConsumerAffairs’ $2.54 sits close to EnergySage and reinforces the same point: Kentucky is cheap, and the headline anchor of $2.65 is, if anything, the conservative one. EcoGen’s numbers are followed throughout, and EnergySage’s are the check on them.
Solar Panel Cost in Kentucky by System Size
The per-watt price is the unit. The system size is the decision. At $2.65 a watt, every added kilowatt costs $2,650 before incentives, and every added kilowatt makes about 1,382 kilowatt-hours a year in Kentucky sun.
The table below prices the sizes Kentucky homeowners actually buy, with the production each one makes and the share of an average home’s 12,564 kilowatt-hours a year that it covers. Production uses the EcoGen anchor of 1,382 kilowatt-hours per kilowatt per year.
A lower model from SunMetricLab, about 1,226 kilowatt-hours per kilowatt, would cut each production figure by about 11%. A 7.77 kW system would make about 9,530 kilowatt-hours instead of 10,738. That spread is flagged wherever it matters.
| System size | Cash cost at $2.65/W | Production per year | Share of average home use |
|---|---|---|---|
| 4 kW | $10,600 | ~5,528 kWh | ~44% |
| 5 kW | $13,250 | ~6,910 kWh | ~55% |
| 6 kW | $15,900 | ~8,292 kWh | ~66% |
| 7 kW | $18,550 | ~9,674 kWh | ~77% |
| 7.77 kW (state typical) | $20,591 | ~10,738 kWh | ~85% |
| 8 kW | $21,200 | ~11,056 kWh | ~88% |
| 9 kW | $23,850 | ~12,438 kWh | ~99% |
| 10 kW | $26,500 | ~13,820 kWh | ~110% |
| 12 kW | $31,800 | ~16,584 kWh | ~132% |
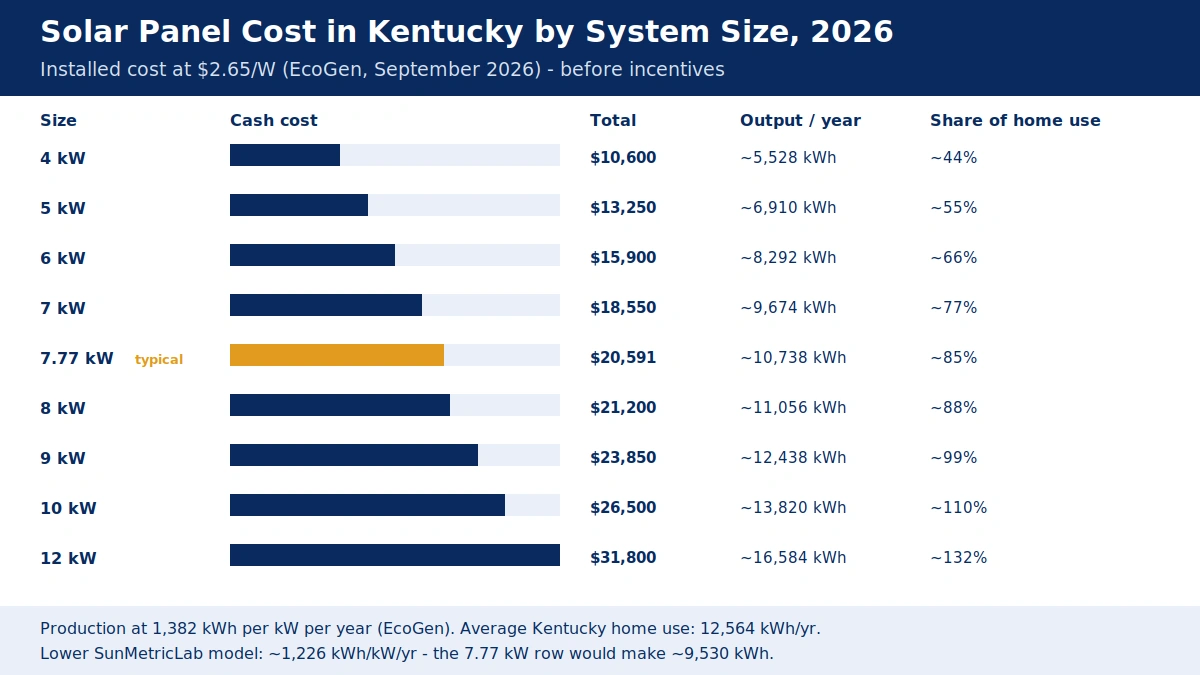
The covering size for the average Kentucky home is about 9.1 kW: 12,564 kilowatt-hours divided by 1,382 per kilowatt. The typical buyer installs 7.77 kW, about a kilowatt and a third short of full coverage.
That shortfall is not a mistake. It is the shape of the Kentucky market, and it follows from the export credit. Every kilowatt past the household’s own use earns 7.089 or 7.534 cents, while every kilowatt used at home is worth about 11.5 cents in energy charges or 13.8 cents all-in.
A system sized to 100% of use still exports a share of its output on sunny spring afternoons when nobody is home. A system sized past 100% exports more of it at the lower rate. The economics push toward a system that covers most of the bill and leaves the last slice to the grid.
That logic cuts the other way for households that use more than the state average. A Louisville home with electric heat, a hot tub, and an electric vehicle can draw 18,000 or 20,000 kilowatt-hours a year. For that house a 12 kW system still covers only about 83% of use.
Size from the last twelve months of bills, not from the state average and not from the floor area. Our 6 kW, 8 kW and 10 kW solar system cost guide prices the three sizes Kentucky buyers choose between most often.
Two cost notes belong here because they surprise first-time buyers. The first is the panel count: at 400 to 450 watts per panel, a 7.77 kW system needs 18 to 20 panels, a 10 kW system needs 23 to 25, and a 12 kW system needs 27 to 30. A roof that holds 20 panels comfortably may not hold 30, and the roof decides the size before the bills do.
The second is the price curve: the per-watt price falls as the system grows, because the fixed costs, the permit, the inspection, the crew’s travel, the interconnection filing, spread across more watts. A 4 kW system at $2.65 a watt is a planning figure. Small systems often price a little higher per watt, and the quote band of $2.33 to $2.97 is where the real numbers land.
One more number belongs in this section because it frames the payback that follows. A 7.77 kW system making 10,738 kilowatt-hours a year, on a home that uses 12,564, offsets about $1,480 of electricity a year if every kilowatt-hour were worth the 13.8-cent residential average.
It is not worth that, because the exported share is worth about half, and the next sections price the split. But $1,480 is the ceiling. No Kentucky system earns more than its production times the retail rate, and any savings claim above that ceiling is selling something that is not on the roof.
What Louisville, Lexington & Northern Kentucky Actually Pay
Kentucky is one state with four electric maps, and the city on the bill decides the solar math more than the roof does. Louisville sits on LG&E. Lexington sits on KU.
Northern Kentucky sits on Duke Energy Kentucky. Eastern Kentucky sits on Kentucky Power.
Western Kentucky sits on co-ops and municipal utilities, many of them inside Tennessee Valley Authority territory, where the rules are different again. The installed price of the panels barely moves between these cities.
Crews and materials cost roughly the same in Louisville as in Lexington. But the value of the power moves by a third, and the payback moves by years.
Louisville is the biggest solar market in the state, and it is the LG&E market. A 7.77 kW system there costs about $20,591 at the state anchor, makes about 10,738 kilowatt-hours a year, and earns 7.089 cents for every kilowatt-hour it sends out.
LG&E’s energy charge on power bought back is 11.499 cents, and the basic service charge of $0.48 a day, about $14.60 a month, stays on every bill whether the panels make power or not. That fixed charge is the part of the bill solar cannot touch. On a small system it is a real slice: a household that zeroes its energy charges still pays about $175 a year in basic service charges alone.
Louisville roofs are mostly asphalt shingle on post-war and newer suburban stock, with good southern exposure in the subdivisions east and south of the city. The install season runs year-round. Kentucky winters are mild enough that crews work through them, which is one reason the state’s installed price runs low.
Lexington is the KU market, and it is the slightly better one. The same 7.77 kW system costs the same $20,591, makes the same 10,738 kilowatt-hours, and earns 7.534 cents per exported kilowatt-hour, about 6% more than LG&E pays. KU’s energy charge is 11.396 cents, a touch lower than LG&E’s.
The difference is small in any single month and worth roughly $20 a year on the typical system at a 40% export share. It is not the reason to buy in Lexington. The reason to buy in Lexington is the same as in Louisville: a big, competitive installer market, straightforward roofs, and a regulator-set export rate that has been stable since the August 2024 order and was kept in place in February 2026.
Northern Kentucky, Covington, Newport, Florence, and the Cincinnati suburbs, is the Duke Energy Kentucky market, and it is the one where the buyer has to read the paperwork twice. Customers who began net metering before January 1, 2025 stay on the legacy Net Metering I tariff for 25 years at the same premises, at the old one-for-one terms.
New customers go on Net Metering II, where the export credit is set by the Commission: it rose from 6.2924 cents to 7.4805 cents per kilowatt-hour on July 10, 2026, and the PSC adjusted the NM II rate methodology again in 2026. A court appeal challenges the 2024 decision that built the new tariff structure, which means the rules a northern Kentucky buyer signs under could still move.
The installed price is the same, the sun is the same, and the export credit is close to KU’s. But the legal ground is less settled than in Louisville or Lexington. A buyer there should ask the installer to put the current NM II credit in writing on the quote, with the date it was set.
Eastern Kentucky, Pikeville, Hazard, Ashland, and the coal counties, is Kentucky Power territory, and it is the thinnest solar market in the state. Kentucky Power’s current export credit applies from March 1, 2026, and the exact rate could not be verified from a current published source.
No verified rate is printed here, because an eastern Kentucky buyer who signs on a guessed rate is signing on a guess. The roofs are also harder: steep pitches, metal roofing, and shaded hollows cut into production, and the installer base is thinner, which can push the per-watt price above the state anchor.
The case for solar in the east rests on the same arithmetic as everywhere else in the state. But the buyer there needs a site-specific production estimate and a written export rate before anything else. The numbers are not settled, and no pretense otherwise helps.
Western Kentucky, Bowling Green, Owensboro, Paducah, and the co-op counties, is the hardest to generalize about, because it is not one market at all. Bowling Green and Owensboro have municipal utilities that set their own terms. The state net-metering law does not cover city utilities, though many offer net metering anyway.
The rural co-ops, Warren, West Kentucky, Pennyrile, Gibson, Tri-County among them, are mostly inside TVA territory, where there is no net-metering requirement. The historical route was TVA’s Green Power Providers program, whose current status could not be verified from a current source.
A western Kentucky buyer should treat the utility’s written terms as the first document in the file, before the quote and before the production estimate. The export value there is whatever the local utility says it is, and it varies by the mile.
| City / area | Utility | Export credit (new customers) | Energy charge | What to confirm in writing |
|---|---|---|---|---|
| Louisville | LG&E | 7.089 cents/kWh | 11.499 cents/kWh | NMS-2 rate, $0.48/day service charge |
| Lexington / central KY | KU | 7.534 cents/kWh | 11.396 cents/kWh | NMS-2 rate, service charge |
| Covington / Newport | Duke Energy KY | 7.4805 cents/kWh (NM II, from Jul 10, 2026) | Ask the utility | NM II terms, appeal status |
| Pikeville / Hazard | Kentucky Power | Not verified — applies from Mar 1, 2026 | Ask the utility | Exact current export rate |
| Bowling Green / Owensboro | Municipal | Varies — not required by law | Ask the utility | Whether net metering is offered at all |
| Western KY co-ops | TVA local power companies | Varies — no net-metering requirement | Ask the utility | Current export or purchase terms |
The pattern is simple: the two big investor-owned utilities publish their rates and the regulator keeps them, and everywhere else the buyer has to ask. Louisville and Lexington buyers can plan. Northern Kentucky buyers can plan with a footnote.
Eastern and western Kentucky buyers should get the utility’s answer in writing before they get the installer’s quote, because the quote is meaningless without it.
Kentucky’s Coal Grid: Why Cheap Power Makes Solar a Harder Sell
Kentucky generates about two-thirds of its electricity from coal. In 2025 coal produced 65.9% of the electricity generated in the state, fossil fuels supplied 91.6%, and renewables supplied 8.3%.
That share has fallen from about 90% in the early 2000s, and it keeps sliding. But it still leaves Kentucky second among the states in the share of its generation that comes from coal. Kentucky is also the fifth-largest coal-producing state in the country, and about half of the coal it mines is burned inside the state.
The grid is, in the plainest sense, a coal grid, and it sets the price of everything solar competes against.
The price it sets is low. Kentucky homes pay an average of 13.8 cents per kilowatt-hour, against a national average of 18.16 cents, the eighth-lowest residential rate in the country and 24% below the national figure. The average monthly bill runs about $128.
That cheap power is the reason Kentucky’s solar payback runs long. The same panels that pay back in eight years in California take 17 to 20 years in Kentucky, not because Kentucky’s panels cost more, they cost less, but because the power they replace costs less.
A solar system is a bet against the price of grid power. The other electrification bet in Kentucky is the heat pump, and our heat pump cost guide for Kentucky prices that one the same way. In Kentucky that bet starts from a low price, and the system has to earn its keep from a smaller spread.
Cheap power also shapes the politics of the export credit. The Public Service Commission sets what LG&E and KU pay for exported power, and it set those rates at 7.089 and 7.534 cents, roughly two-thirds of the energy charge and about half the all-in residential rate.
The utilities argued for less. Solar advocates argued for the full retail rate. The Commission split the difference, and then kept the rates in its February 16, 2026 orders, with new base rates barred before August 1, 2028.
That gives a buyer something rare in American solar policy: a rate that is written down, dated, and not scheduled to move for more than two years. It is a low rate. It is also a known rate, and a known low rate beats an unknown rate for planning purposes.
The coal grid cuts the other way on one point, and it is worth naming. Coal plants retire. Kentucky’s coal share has dropped by about a third since the early 2000s, and the plants that remain are aging.
When a coal plant closes, the power that replaces it costs more to build, and rates rise. EIA’s August 2026 release already shows Kentucky’s residential rate up 5.3% on the year before. A system bought in 2026 locks in its production cost on the day it is installed, the panels do not get more expensive to run, while the grid power it replaces gets more expensive over time.
That is the long case for Kentucky solar, and it is a real one, but it is a slow case: it pays out over twenty years, not five. A buyer who needs the money back quickly is buying the wrong product in this state.
There is a second long case, and it is about the house rather than the grid. A solar system adds a fixed, known cost of power to a house whose other costs are rising, and it does so for 25 years, the warranted life of the panels.
It also adds resilience in a state that sees ice storms, summer thunderstorms, and the occasional tornado, though only with a battery. Panels alone shut down when the grid goes down, a point the battery section takes up in full.
None of this makes the payback shorter. It makes the payback less important, for a buyer who values certainty and a buyer who plans to stay in the house for twenty years.
For a buyer who plans to move in five, the coal grid wins, and the advice is to wait.
One more Kentucky fact belongs here because it shapes the installer market. Kentucky is a regulated market with no supplier choice: the law gives each utility an exclusive certified territory, and customers cannot switch providers.
That means the utility on the bill is the utility on the bill for the life of the house, and the export rate is not a shopping decision. It also means the installer cannot sell a different utility’s better rate. The buyer shops installers, not utilities, and the only rate that matters is the one printed on the bill already arriving in the mailbox.
Net Metering in Kentucky: NMS-2, LG&E, KU & the 7-Cent Export Credit
Net metering is the mechanism that decides whether a Kentucky system pays back in 17 years or 20, and it is the section that matters most. The law is KRS 278.465 and KRS 278.466, the state net-metering law.
It requires utilities to offer net metering for eligible systems up to 45 kW, far above any residential system. It lets a utility stop accepting new customers once net-metered capacity reaches 1% of its peak demand. That 1% cap is the one number in the law that a buyer should check, because a utility that has hit it can close the door.
Whether any Kentucky utility is near the cap could not be verified, and no guess is printed here.
The history splits Kentucky solar owners into two groups, and the group determines the rate. Customers who began net metering before September 24, 2021 keep one-for-one kilowatt-hour credits for 25 years: every kilowatt-hour sent out cancels a kilowatt-hour bought back, at full value.
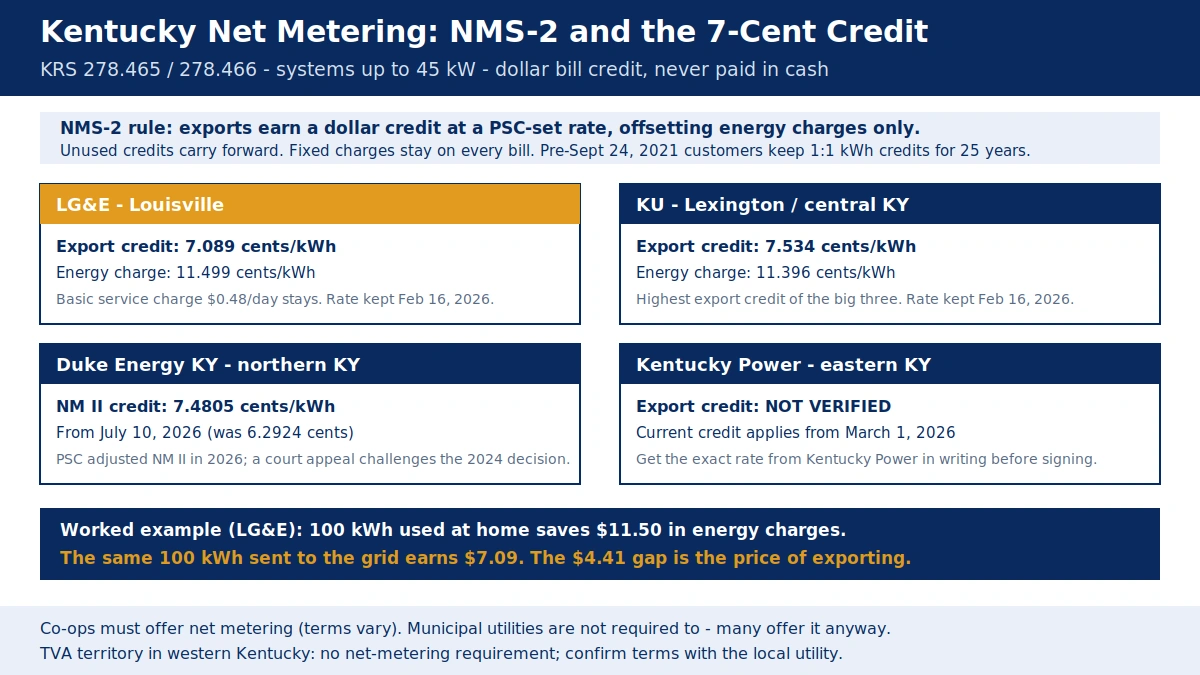
Customers who started on or after that date go on NMS-2, the tariff for new net-metering customers. Under NMS-2 the exported kilowatt-hour earns a dollar credit at a rate the Public Service Commission sets in each utility’s rate case.
The credit offsets energy charges only, not fixed charges. Unused credits carry forward to the next bill.
They are never paid out in cash, and they cannot be moved to another account. That is the whole mechanism, and the numbers are the ones that follow.
On LG&E, the export credit is 7.089 cents per kilowatt-hour, set by the PSC order of August 30, 2024 in Case 2023-00404 and kept in the Commission’s February 16, 2026 rate orders. The energy charge on power bought back is 11.499 cents, in force from September 1, 2026. The basic service charge is $0.48 a day.
The worked example the utilities themselves use is the clearest way to see it: 100 kilowatt-hours of solar used at home saves $11.50 in energy charges, and the same 100 kilowatt-hours sent to the grid earns $7.09. The $4.41 difference is the price of exporting, and it is paid on every kilowatt-hour the house cannot use the moment it is made.
On KU, the export credit is 7.534 cents per kilowatt-hour, set by the same August 2024 order and kept in the same February 2026 orders. The energy charge is 11.396 cents. The worked example runs the same way: 100 kilowatt-hours used at home saves about $11.40, and 100 sent out earns $7.53.
KU pays about 6% more for exports than LG&E, which is worth roughly $20 a year on the typical system. It is a real difference and a small one, and no buyer should choose a house by it.
Duke Energy Kentucky runs its own successor tariff, Net Metering II, for customers who started on or after January 1, 2025. The NM II credit rose from 6.2924 cents to 7.4805 cents per kilowatt-hour on July 10, 2026, and the PSC adjusted the NM II rate methodology again in 2026.
Customers who began before January 1, 2025 stay on the legacy Net Metering I tariff for 25 years at the same premises. A court appeal challenges the 2024 decision that built the new tariff structure, so the NM II rules carry a legal footnote that NMS-2 does not. A northern Kentucky buyer should ask for the current NM II credit in writing, with the date, and should know that it can move with the appeal.
Kentucky Power’s current export credit applies from March 1, 2026. The exact rate was not verified from a current published source, and no number is printed here that could not be checked.
An eastern Kentucky buyer should get the rate from Kentucky Power in writing before signing anything. Any installer quote that prints a Kentucky Power export rate without a source needs a second look.
The co-ops and the municipal utilities follow different rules again. The 19 state-regulated rural electric cooperatives must offer net metering, but the details vary from co-op to co-op, and the export rate is set utility by utility.
The municipal utilities, Paducah, Bowling Green, Owensboro, and about 28 others, are not covered by the state net-metering law at all, and they set their own terms. Many offer net metering, but none is required to. The TVA local power companies in western Kentucky are not required to offer net metering either, and the historical route there was TVA’s Green Power Providers program, whose current terms could not be verified.
The rule for all three groups is the same: get the utility’s terms in writing first, and price the system from those terms, not from the state average.
The practical consequences of NMS-2 are three, and they decide how a Kentucky system should be sized and run:
- Self-consumption is worth more than exporting, by about 4.4 cents a kilowatt-hour on LG&E and about 3.9 cents on KU. A household that uses its solar power the moment it is made, running the dishwasher at noon, charging the car in the afternoon, pre-cooling the house before the evening peak, earns more from the same panels than a household that exports half its output.
- The fixed charges never go away. The $0.48-a-day basic service charge on LG&E, and its KU equivalent, stays on every bill, which puts a floor under the monthly payment of about $15 no matter how much the panels make.
- The credit is a bill credit, not a payment. A system that makes more power than the house uses in a year does not earn a check; it earns a credit balance that carries forward and is never paid in cash. Oversizing past the household’s annual use is money spent on panels that earn credits the house may never spend.
One more protection is worth naming because buyers ask about it. The 25-year grandfathering for pre-September 2021 customers is written into the tariff, and it runs with the premises, not the person.
A house that already has one-for-one net metering keeps it when it is sold, for the remainder of the 25 years. That makes a house with an existing grandfathered system worth more than the same house without one. It is a question worth asking when buying a Kentucky home that already has panels on the roof: when did the system start net metering, and how many grandfathered years are left.
Payback in Kentucky: The Math at 7 Cents an Export
Payback is the number every Kentucky buyer asks for first, and it is the number most often misquoted. This section shows the arithmetic in full, with the assumptions on the table, so the reader can check it against any quote.
The figures are illustrative arithmetic from the EcoGen anchors, not a quote, and they are labeled as such wherever they appear.
Start with the typical system: 7.77 kW at $2.65 a watt, $20,591 before incentives, making about 10,738 kilowatt-hours a year at 1,382 kilowatt-hours per kilowatt. There is no federal credit to subtract in 2026, no state rebate to subtract, and no utility rebate to subtract for most buyers. The net cost is the gross cost: $20,591.
That is the denominator. The numerator is the value of the power the system makes in a year, and it depends on one thing the installer cannot know without asking: how much of the power the household uses itself.
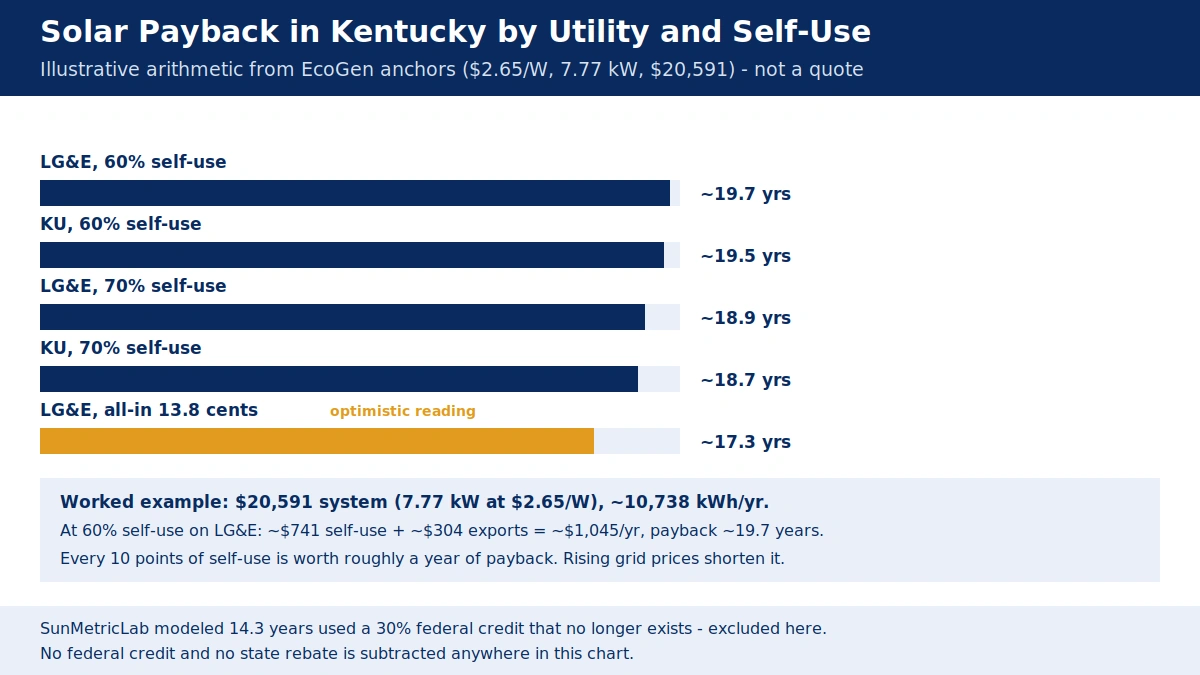
On LG&E, a kilowatt-hour used at home is worth 11.499 cents in energy charges, and a kilowatt-hour sent out is worth 7.089 cents. At 60% self-consumption, the household uses 6,443 kilowatt-hours at home and exports 4,295. The year-one value is about $741 from self-use plus about $304 from exports, or about $1,045 a year.
Divide $20,591 by $1,045 and the simple payback is about 19.7 years. At 70% self-consumption, 7,517 kilowatt-hours at home and 3,221 exported, the value is about $864 plus about $228, or about $1,092 a year, and the payback is about 18.9 years.
At 50% self-consumption the value falls to about $1,006 a year and the payback stretches past 20 years. The pattern is plain: every ten points of self-consumption is worth roughly a year of payback.
Value the self-consumed power at the all-in residential rate of 13.8 cents instead of the 11.499-cent energy charge, and the numbers shorten. At 60% self-consumption the year-one value is about $889 from self-use plus $304 from exports, about $1,193 a year, and the payback is about 17.3 years.
That is the optimistic reading, and it assumes the household’s self-consumed power displaces the full retail rate including the fixed-charge portion of the bill, which it does not fully do. The range, stated with the assumptions shown, is about 17 to 20 years before incentives.
Any quote that promises a Kentucky payback under 15 years on an owned 2026 system should be asked to show its arithmetic, line by line.
KU runs a little faster, because its export credit is a little higher. At 60% self-consumption the year-one value is about $734 from self-use at 11.396 cents plus about $324 from exports at 7.534 cents, about $1,058 a year, and the payback is about 19.5 years. At 70% it is about $1,103 a year and about 18.7 years.
The gap between the two utilities is months, not years, and it should not decide anything.
Three things move the payback more than the utility does:
- The price of grid power over time. EIA’s August 2026 release shows Kentucky’s residential rate up 5.3% on the year before. If grid power rises 3% a year, a system that saves $1,045 in year one saves about $1,076 in year two and about $1,400 in year fifteen, and the payback shortens by roughly two years against the flat-rate math. If grid power stays flat, it does not.
- The production model. The lower SunMetricLab model, about 1,226 kilowatt-hours per kilowatt, cuts annual production by about 11% and stretches the payback by about two years. A quote that uses a high production model and a high escalation rate can make the same system look five years faster than a quote that uses neither, and both quotes can be built in good faith.
- The roof. Shade, a north-facing pitch, or a low slope can cut production by 10 to 20%, and no rate of grid escalation recovers power the panels never made.
The 25-year picture is the one that makes Kentucky solar defensible at all. ConsumerAffairs models $42,146 in avoided utility costs over 25 years for a Kentucky homeowner with solar. That is a modeled figure, built on rising rates and a system that keeps producing, and it is labeled as one.
Against a $20,591 system, it implies about $21,500 of net value over the life of the panels, before maintenance and before the inverter replacement that most systems need once, around year 12 to 15, at roughly $1,500 to $2,500. The system earns its money back late, and then it earns.
A buyer who will own the house for 25 years gets the whole curve. A buyer who will own it for ten gets the flat part, and should know that before signing.
One comparison puts the Kentucky payback in its proper frame. The national solar payback in 2026 runs 6 to 12 years in the states where power is dear and the sun is strong. Kentucky runs 17 to 20.
The panels cost less here. The power costs less here. The second fact beats the first by about eight years.
That is not a reason to dismiss solar in Kentucky. It is a reason to buy it for the right reasons, a long stay in the house, a high daytime load, a roof that faces south and clear, and to walk away when those reasons are missing.
Batteries in Kentucky: Backup Power, Not Extra Income
A battery changes what a Kentucky solar system does, and it does not change what it earns. That distinction is the whole battery section. In states with time-of-use rates, a battery earns money by storing cheap midday power and discharging it at expensive evening rates.
Time-of-use rates charge different prices at different hours of the day. Kentucky has no residential time-of-use rate worth arbitraging on LG&E or KU, and no battery incentive.
A battery in Kentucky earns nothing. It buys something else: power when the grid goes down.
The price is the first fact. A 10 to 13.5 kilowatt-hour home battery, installed alongside the panels, runs about $10,000 to $14,000 in Kentucky in 2026, before any incentive, and there is no incentive to subtract. Added to a $20,591 system, it lifts the job to roughly $31,000 to $35,000.
It adds about ten years to the payback if the buyer counts it as part of the solar investment, because it adds cost and no income. Price a battery as a separate purchase with a separate purpose: backup power, bought with the same money that would otherwise buy a generator.
The comparison with a generator is the useful one. A standby generator costs $5,000 to $10,000 installed, runs on natural gas or propane, and powers the whole house for as long as the fuel lasts. A battery powers a chosen set of circuits, refrigerator, lights, internet, a medical device, for hours, silently, and recharges from the panels the next day.
The generator wins on duration and on whole-house coverage. The battery wins on silence, on fuel independence, and on the fact that it is already on the wall when the outage starts, with no startup and no fuel run.
Kentucky’s outage record makes the choice a real one rather than a theoretical one: ice storms knock out power across the state most winters, summer thunderstorms do the same, and western Kentucky’s tornado exposure is the highest in the state. A household with a medical device, a sump pump, or a well pump has a reason to own backup power that has nothing to do with payback.
Two technical facts belong here. First, panels alone do not power a house during an outage.
A grid-tied inverter shuts down when the grid goes down, by law, so that line workers are not working on a live line fed by a rooftop. A buyer who wants power during an outage needs a battery and an islanding setup, and should confirm in writing that the quoted system includes it.
Second, a battery does not raise the export credit. Power stored in the battery and used at home is worth the retail rate, which is the same value the panels earn by direct self-consumption. The battery only changes when the power is used, not what it is worth.
A battery can lift self-consumption from 60% toward 80%, which is worth roughly a year of payback on the panel side, but it costs $10,000 to $14,000 to buy that year back. The arithmetic does not close.
The sizing rule for a Kentucky battery is simple: size it to the circuits that must stay on, not to the house. A 10 kilowatt-hour battery runs a refrigerator, lights, phones, and a medical device overnight. It does not run central air conditioning through a July night, and it does not run electric heat through a January one.
The installer should list the backed-up circuits in writing, with the runtime at each load, before the battery is ordered. A battery sold as whole-house backup for a Kentucky home with electric heat is a battery sold on a promise it cannot keep.
Kentucky Solar Incentives in 2026: What Exists and What Does Not
The short version of this section is that Kentucky has almost no solar incentives. The long version is a list of the programs that sound like they exist and do not, for Kentucky, in 2026. Start with the ones that do not exist, because they are the ones that appear in quotes.
There is no Kentucky state tax credit for home solar. There is no Kentucky state rebate for home solar.
There is no utility rebate for home solar on LG&E or KU. No county or city in Kentucky runs a solar rebate that could be verified.
A quote that deducts a state rebate is deducting money that does not exist. The buyer should ask for the program name, the administering agency, and the application form before signing anything that carries that line.
The federal Home Energy Rebates program, HEAR and HOMES, the two programs funded by the Inflation Reduction Act and run state by state, holds $134,246,890 for Kentucky: $66,927,750 for HEAR and $67,186,688 for HOMES. Kentucky’s program applications are conditionally approved, and the Kentucky Energy and Environment Cabinet’s Office of Energy Policy runs the program.
But the program is not yet accepting rebate applications. The state’s own page says so in plain words: “Please be aware that the Kentucky Home Energy Rebates Program is not yet accepting rebate applications.” The state must complete additional documents and receive approval from the U.S. Department of Energy before it can launch, and no launch date has been announced.
A Kentucky buyer cannot count on a dollar of HEAR or HOMES money in 2026. A quote that prices it in is pricing a program that has not opened.
Two more facts about HEAR and HOMES matter even after the program opens. HEAR pays up to $8,000 for income-qualified households, but it pays for electric appliances, insulation, air sealing, wiring, and electrical panel upgrades, not for solar panels. Since DOE Program Notice 26-2 took effect on May 29, 2026, HEAR is electric-to-electric only: it does not pay to replace gas, oil, or propane equipment, and insulation and air sealing come before heating and cooling upgrades.
HEAR does not pay for solar, and no launch of the program will change that. HOMES pays up to $8,000 for whole-home efficiency upgrades measured by modeled or metered energy savings. A solar array is not a whole-home efficiency upgrade under that program.
The Kentucky program, when it opens, is designed to target low-income single-family and mobile homes and weatherization upgrades across all housing units. It is a weatherization program with a solar-shaped hole in it. No buyer should wait for a rebate that was never meant for their roof.
Solar for All, the federal program that would have funded solar for low-income households, was terminated by the EPA in August 2025 after Congress repealed its funding authority. The termination is being challenged in court, and as of July 2026 Kentucky had not opened applications under it. There is nothing to apply for, and nothing to wait for.
What does exist is small and specific. LG&E and KU run no solar rebate, but both utilities’ net-metering tariffs are themselves the incentive: the export credit is the payment, and it is the only payment most Kentucky buyers will ever see.
Some Kentucky installers run group-buy or neighborhood discounts, and a few credit unions offer solar loans at below-market rates. Both are worth asking about, and neither is a program with a published rate that could be verified. The federal programs that do exist for Kentucky homeowners in 2026 are the ones in the next section, and they are a credit that ended and a lease window that has not.
| Program | Amount | Kentucky status in 2026 | Pays for solar? |
|---|---|---|---|
| Federal §25D residential credit | 30% (ended) | $0 for 2026 owned installs | Was the main credit; now gone |
| Federal §25C efficiency credit | Up to $3,200 (ended) | $0 for property placed in service after Dec 31, 2025 | Never paid for solar panels |
| HEAR (HEEHR) | Up to $8,000 | Not yet accepting applications in KY | No — appliances, insulation, wiring, panels |
| HOMES | Up to $8,000 | Not yet accepting applications in KY | No — whole-home efficiency upgrades |
| §48E lease pass-through | Varies by lease | Available if system in service by Dec 31, 2027 | Yes, via the leasing company |
| Kentucky state tax credit | None | None exists | No |
| Kentucky state rebate | None | None open | No |
| Solar for All | Terminated Aug 2025 | KY never opened applications | Was low-income solar; now gone |
Federal Help in 2026: No Credit for Owners, a Lease Window Until 2027
The federal picture for a Kentucky homeowner who buys solar in 2026 is simple, and it is the same picture as in every other state: the credit is gone. Public Law 119-21 ended the residential clean energy credit, Section 25D, for systems whose installation was completed after December 31, 2025.
A homeowner who owns the system and installs it in 2026 earns a $0 federal credit. The Section 25C efficiency credit, for windows, doors, insulation, and similar improvements, ended for property placed in service after the same date. The Internal Revenue Service confirmed both end dates in FS-2025-05.
There is no extension, no phase-down, and no grandfathering for a 2026 purchase. Any quote, advertisement, or calculator that deducts 30% from a 2026 Kentucky install is calculating under a law that expired, and the buyer should treat the rest of that quote with the same suspicion. Our federal energy tax credits guide for 2026 tracks both end dates and the lease rule in one place.
That does not mean the federal government has left solar entirely. The commercial credit, Section 48E, still exists for systems owned by a business, which includes a leasing company. A leased system can pass that credit through to the homeowner in the form of lower lease payments, provided the system is in service by December 31, 2027.
That date is the hard edge of the lease window. A lease signed in 2026 for a system that goes live in 2027 can still carry the pass-through. A lease for a system that goes live in 2028 cannot.
The credit belongs to the leasing company, not the homeowner, and the homeowner’s benefit is whatever the lease company chooses to pass through in the monthly payment. A lease quote should state the pass-through in writing, with the in-service date it depends on, and the buyer should know that the company keeps the credit and the buyer keeps the payment.
The lease-versus-own question in Kentucky is sharper than in most states, because the credit is the only thing that ever shortened the payback. An owned system in 2026 costs $20,591 and pays back in about 17 to 20 years. A leased system costs $0 up front and pays back immediately, in the sense that the monthly lease payment is lower than the bill savings from the first month, if the lease is priced fairly.
The catch is the 20- to 25-year term, the escalator that raises the payment every year, the lien or UCC filing on the house, and the fact that the homeowner never owns the panels, never claims the value at sale, and cannot take the system with them when they move. A UCC filing is a public record of the leasing company’s claim on the panels.
The financing section below prices the lease in full. The point here is the federal one: the lease is the only route left in 2026 by which a federal credit reaches a Kentucky roof, and it reaches it through a company, not through the homeowner’s tax return.
One more federal fact belongs here because buyers ask about it every year. There is no federal rebate for solar.
There never has been. The federal help was always a tax credit, a reduction in tax owed, not a check, and it required enough tax liability to use it.
A retiree with little taxable income could not use the full 30% even when it existed. That is gone now, and the only federal money a Kentucky homeowner can touch in 2026 is the HEAR and HOMES money that has not opened, and the lease pass-through that belongs to someone else.
In 2026, a Kentucky homeowner who buys solar pays the full price. The return comes from the meter.
Sizing Your System for a Kentucky Roof: Sun, Shade & Storms
Kentucky gets about 4.2 peak sun hours a day, less than the desert states, more than the Great Lakes states, and enough for the production figures used here. But the statewide average hides the variation that decides a real roof’s output, and the sizing section is where the average stops being useful. Size from the roof and the bills, not from the state.
The sun first. Kentucky’s solar resource is strongest in the west and weakest in the east, where the Appalachian ridges shade the hollows and the morning fog lingers. A south-facing roof at a pitch of 30 to 35 degrees is the ideal, and it is the pitch most Kentucky ranch and two-story roofs already have.
A west-facing roof loses about 10 to 15% against south, and an east-facing roof loses about the same. A north-facing roof loses 25% or more, and a north-facing array in Kentucky is rarely worth building. The installer should produce a shade study, a sun-path measurement taken on the roof, not a satellite estimate, and the production estimate should show the shade loss as a number, not as a word.
A promise of 10,738 kilowatt-hours a year from a 7.77 kW system on a roof with a big oak on the south side means the shade study was skipped.
The roof second. Kentucky roofs are mostly asphalt shingle, and asphalt shingle is the easiest roof to put panels on: the mounts bolt through the shingle into the rafters, the flashing seals the penetration, and the job takes a day or two.
Metal roofs, common on rural homes and barns in eastern Kentucky, are also good. Standing-seam metal takes clamp mounts with no penetrations at all, but corrugated metal needs penetrations and a roofer who knows the profile. Tile and slate are rare in Kentucky and expensive to work on.
The roof’s age matters more than its material: a shingle roof with five years of life left should be replaced before the panels go on, because removing and reinstalling panels to re-roof costs $2,000 to $4,000 and wipes out years of savings. The installer should ask the roof’s age, and the buyer should know it before the first quote arrives. A roof older than 15 years deserves a roofer’s inspection before a solar signature.
The storms third. Kentucky’s weather is the quiet risk in the sizing math.
Spring hail is a real hazard across the state, and panels are rated to UL 61730 and IEC 61730, which test against hail impact. But the rating is a laboratory test, and a severe hailstorm can still damage panels, which is why the homeowner’s insurance policy must cover the array, in writing, before the system goes live.
Ice storms coat panels and the roof alike, and an iced-over array makes nothing until it thaws. Kentucky winters are mild enough that the loss is days, not weeks, but it is a loss the production estimate should carry. Western Kentucky’s tornado exposure is the highest in the state, and a roof in the Jackson Purchase or the Pennyrile should have its racking wind-rated for the local code, with the rating in the contract.
Summer heat is the subtler loss: panels lose efficiency as they heat up, and a Kentucky July afternoon at 95 degrees with high humidity costs a few percent of output against the nameplate rating. The production models used here already carry that loss. A quote that does not is overstating the summer.
The sizing rule that follows from all of this is the one stated earlier and worth repeating: size from the last twelve months of bills. Add up the kilowatt-hours, divide by 1,382, and that is the system size that covers 100% of use.
Then size below it. 85% is where the typical Kentucky buyer lands, and it is where the economics point, because the last kilowatt-hours are the ones most likely to be exported at 7 cents. A household with an electric vehicle, electric heat, or a pool pump should size from the bills it expects next year, not the bills it had last year, and should say so to the installer.
A household that plans to add an EV in two years should size for it now, because adding panels later costs more per watt than building them into the first job. And a household that plans to move in five years should size small or not at all, because the payback runs 17 to 20 years and the house will be someone else’s before the system has earned its keep.
Permits, Licenses, HOA Rules & the Price Drivers
The permit and the license are the parts of a Kentucky solar job that the buyer never sees and should always check. Kentucky has no statewide solar license. The electrical work must be done by a Kentucky-licensed electrician, and the installer should carry both a business license and proof of insurance, with the electrician’s license number on the contract.
The buyer should verify the electrician’s license with the state before signing, and should check that the installer’s general liability and workers’ compensation insurance are current. An installer who cannot produce a license number is an installer who should not be on the roof.
Permitting runs through the county or the city, and it varies across the state. Louisville and Lexington have established solar permit processes, with structural review, electrical review, and an inspection before the system is energized. Smaller counties may take longer, and some rural jurisdictions have no solar-specific process at all, which can mean a slower review rather than a faster one.
The permit fee is usually a few hundred dollars and is inside the quoted per-watt price. The interconnection application, the utility’s permission to connect to its lines, runs in parallel, and it is the step that takes the longest: the utility reviews the application, approves the design, and schedules the meter swap or the permission to operate.
One secondary source puts LG&E and KU interconnection at 30 to 60 days and KU at 45 to 75 days, but those timelines could not be verified from a current primary source, and they are not printed here as fact. The buyer should ask the installer for the utility’s current timeline in writing, and should know that the system cannot be turned on until the utility says so, no matter how finished the roof looks.
Homeowners associations are the other gatekeeper, and Kentucky law gives them more room than the laws of some states. There is no Kentucky statute that flatly bars an HOA from restricting rooftop solar, as there is in some states, so the HOA’s covenants, conditions, and restrictions are the document that matters.
Many Kentucky HOAs require an architectural review before installation, and some restrict panel placement to rear-facing roof slopes or require screening. A buyer in an HOA should get the approval in writing before signing the solar contract, not after, because a contract signed first and an HOA refusal second leaves the buyer with a deposit dispute and no panels.
The installer should have seen the HOA’s rules before quoting. A quote built without them skipped that step.
The price drivers beyond the panels are the ones that separate a $2.33-a-watt quote from a $2.97-a-watt quote on the same roof:
- A panel upgrade, $1,500 to $3,500. The house’s electrical panel is under 200 amps, or it is an old fuse box. It is the most common add-on in Kentucky’s older housing stock, especially in Louisville and Lexington neighborhoods built before 1980.
- Tree work, $500 to $2,000. The second most common add-on, because the same mature oaks that shade a Kentucky yard shade its roof.
- A new roof, $8,000 to $15,000. The biggest add-on of all, and the one that should be done first, before the panels, not after.
- Trenching, $1,000 to $3,000. To a detached garage or a ground mount.
- A battery, $10,000 to $14,000. Priced above.
None of these is inside the $2.65-a-watt figure. All of them should be itemized on the quote, with a price next to each, so the buyer can see what the panels cost and what the house costs.
Solar Loans, Leases & PPAs in Kentucky: The Financing Traps
How a Kentucky buyer pays for solar matters more than it does in most states, because there is no credit to soften a bad loan and no rebate to cover a dealer fee. The cash price is $20,591 for the typical system. Everything else is a way of paying that price, and every way except cash costs more.
Cash is the cheapest route, and it is the benchmark every other route should be measured against. A cash buyer pays $20,591, owns the system from day one, keeps the export credits, and sells the house with the panels on it.
A cash buyer also has the shortest payback, because there is no interest and no fee. The only reason not to pay cash is that the cash is needed elsewhere, and that is a real reason. But it should be weighed against the cost of the loan, which is the next paragraph.
A solar loan is the most common route, and it is where the traps live. The trap is the dealer fee: 20 to 30% of the cash price, folded into the loan amount, so that a $20,591 system becomes a $25,000 to $27,000 loan, and the monthly payment is calculated on the larger number.
The fee is invisible on the quote unless the cash price sits next to the financed price, and many quotes show only the financed price. The buyer should insist on both numbers, in writing, and should compare the loan’s interest rate and term against a home equity loan or a personal loan from their own bank or credit union, which carries no dealer fee.
A 25-year solar loan at a low headline rate with a 25% dealer fee costs more than a 15-year home equity loan at a higher rate with no fee. The only way to see that is to compare the total paid over the life of each loan, not the monthly payment.
A $0-down loan is not a $0-cost loan. It is a loan with the down payment folded into the balance.
A lease is the second route, and it is the only one that still carries a federal credit, through the Section 48E pass-through described above. The homeowner pays $0 up front and a monthly lease payment, usually with an annual escalator of 2 to 3%, for 20 to 25 years.
The leasing company owns the panels, claims the credit, and keeps the export credits or passes them through according to the lease. The homeowner’s benefit is the difference between the lease payment and the bill savings, which should be positive from the first month if the lease is priced fairly.
The costs are the term, the escalator, and the exit: selling a house with a leased system means the buyer must take over the lease or the seller must buy it out, and either one can kill a sale. A lease should be read in full, including the escalator, the buyout price, and the transfer clause, before it is signed. A lease that does not state the Section 48E pass-through in writing should be assumed not to carry one.
A power purchase agreement, or PPA, is the third route, and it is the least common in Kentucky. The homeowner buys the power the panels make at a set rate per kilowatt-hour, rather than leasing the panels themselves. The economics resemble a lease, and the traps resemble a lease’s: the escalator, the term, and the transfer on sale.
PPAs are rare enough in Kentucky that a buyer offered one should ask why the company is selling power rather than panels, and should compare the PPA rate against the utility’s 13.8-cent residential rate. A PPA rate above the utility rate is a bad deal on its face, and a PPA rate below it still needs the escalator checked, because a 3% escalator overtakes a flat utility rate in about a decade.
The rule that covers all three routes is the same: get the cash price in writing, get the total paid over the life of the deal in writing, and compare the two. A financing offer that will not show the cash price is an offer that is hiding the dealer fee. A financing offer that will not show the total paid is an offer that is hiding the interest.
Any offer that deducts a 30% federal credit from a 2026 Kentucky install is an offer built on a law that expired on December 31, 2025.
Getting Quotes in Kentucky: The Checklist
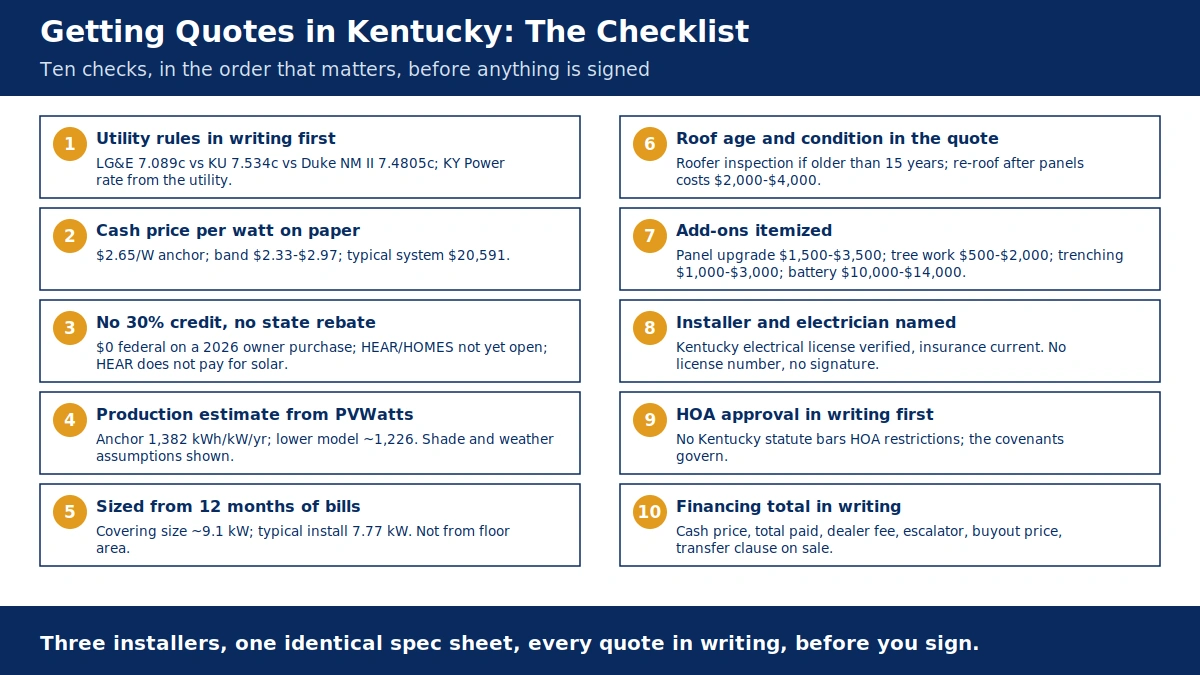
Ten checks, in the order that matters, before anything is signed.
- Your utility’s rules in writing first. LG&E 7.089 cents, KU 7.534 cents, Duke NM II 7.4805 cents from July 10, 2026, Kentucky Power’s rate from the utility itself, co-op and municipal terms from the local utility. The export rate is worth more than the panel brand, and the gap between the best and worst utility terms in the state is worth years of payback.
- The cash price per watt on paper. The anchor is $2.65 a watt, the band is $2.33 to $2.97, and the typical system is $20,591. A quote without a cash price per watt has not been priced.
- Strike any line claiming a 30% federal credit or a Kentucky rebate. Neither exists for a 2026 purchase. The federal credit is $0 for a 2026 owned install. Kentucky has no state tax credit and no state rebate. HEAR and HOMES are not yet accepting applications, and HEAR does not pay for solar in any case.
- The production estimate from PVWatts or an equivalent model, with the shade and weather assumptions shown. The anchor is 1,382 kilowatt-hours per kilowatt per year, and the lower model is about 1,226. A quote that promises more than 1,382 without a shade study and a south-facing roof is promising more than the roof will make.
- The system sized from twelve months of bills, not from the floor area. The covering size for the average Kentucky home is about 9.1 kW, and the typical buyer installs 7.77 kW. A quote that sizes past 100% of use should explain why, in writing.
- The roof’s age and condition in the quote, with a roofer’s inspection if the roof is older than 15 years. A re-roof after the panels go on costs $2,000 to $4,000 in removal and reinstallation alone.
- Add-ons itemized: panel upgrade when the panel is under 200 amps or a fuse box, tree work, trenching, battery, and any structural work. Each with a price. None of them inside the per-watt figure.
- The installer and the electrician identified by name, with the Kentucky electrical license verified and insurance current. No license number, no signature.
- The HOA approval in writing first, where an HOA exists. Kentucky has no statute barring HOA restrictions on rooftop solar, and the covenants are the document that matters.
- The financing total in writing: the cash price, the loan or lease total paid over its life, the dealer fee if there is one, the escalator if there is one, the buyout price, and the transfer clause on sale. Three installers, one identical spec sheet, every quote in writing, before you sign.
The households that should sign in 2026 share four traits: a house the buyer will own for twenty years, a south-facing roof with little shade, a daytime load that uses most of the power the panels make, and a utility on LG&E or KU with the export rate in writing.
The households that should wait are the ones with a north-facing roof, a move planned inside five years, a roof older than the panels would outlive, or a co-op or municipal utility whose export terms are still unwritten. Kentucky solar pays, slowly, for the right house. For the wrong one, the cheapest panels in the region are still the wrong purchase, and the advice is one word: wait.
A renter, a shaded roof, or a household that will move before payback arrives may do better with community solar, which needs no roof at all.
How much do solar panels cost in Kentucky in 2026?
A typical 7.77 kW system costs about $20,591 installed at $2.65 per watt before incentives, based on EcoGen’s September 2026 Solar Cost Index. Quotes generally land between $2.33 and $2.97 per watt, and EnergySage puts Kentucky lower, at $2.48 a watt in October 2026, with a 7 kW system at about $17,360. There is no federal credit and no state rebate to subtract from those figures in 2026, so the quoted price is close to what you actually pay.
What does LG&E pay for solar power sent to the grid?
LG&E pays 7.089 cents per kilowatt-hour for power exported under its NMS-2 tariff, which covers systems that started net metering on or after September 24, 2021. The energy charge on power you buy back is 11.499 cents, the basic service charge of $0.48 a day stays on every bill, and the Public Service Commission kept the 7.089-cent rate in its February 16, 2026 rate orders. Customers who started net metering before September 24, 2021 keep one-for-one kilowatt-hour credits for 25 years.
What does Kentucky Utilities pay for exported solar power?
Kentucky Utilities pays 7.534 cents per kilowatt-hour under NMS-2, against an energy charge of 11.396 cents for power bought back. The rate was set by the Public Service Commission’s order of August 30, 2024 and kept in the February 16, 2026 rate orders. Unused credits carry forward to the next bill, offset energy charges only, and are never paid out in cash.
How long is the solar payback in Kentucky?
About 17 to 20 years before incentives for an owned system, depending on how much of the power the household uses itself. At 60% self-consumption on LG&E, a typical $20,591 system earns about $1,045 a year and pays back in about 19.7 years, while at 70% self-consumption it earns about $1,092 a year and pays back in about 18.9 years. Valued at the all-in 13.8-cent residential rate, the payback shortens to about 17.3 years, and rising grid prices shorten it further, while a lower production model or a shaded roof lengthens it.
Is there a Kentucky state rebate or tax credit for solar panels?
No. Kentucky offers no state tax credit and no state rebate for home solar, and no rebate was open as of November 2026. The federal Home Energy Rebates program holds $134 million for Kentucky, but the state is not yet accepting applications, and its HEAR program does not pay for solar panels in any case, since it pays for electric appliances, insulation, air sealing, wiring, and panel upgrades for income-qualified households.
Can I still get the 30% federal solar tax credit in Kentucky in 2026?
No, not on a system you own. Public Law 119-21 ended the Section 25D residential credit for systems completed after December 31, 2025, so a 2026 owned install earns a $0 federal credit. The commercial Section 48E credit can still reach a Kentucky roof through a lease, if the system is in service by December 31, 2027, but the credit belongs to the leasing company, and the homeowner’s benefit is whatever the lease passes through in lower monthly payments.
Is a battery worth it with solar in Kentucky?
A battery is worth it for backup power, not for extra income. Kentucky has no residential time-of-use rate to arbitrage and no battery incentive, so a battery earns nothing, and it keeps chosen circuits running during an outage, which matters in a state that sees ice storms, summer thunderstorms, and tornadoes in the west. A 10 to 13.5 kilowatt-hour battery costs about $10,000 to $14,000 installed, and panels alone shut down during an outage, by law, so backup power needs a battery and an islanding setup, confirmed in writing.
Should I lease solar panels in Kentucky or buy them?
Buying is cheaper over the life of the system: a typical owned system costs about $20,591 and pays back in about 17 to 20 years, and the owner keeps the panels and the export credits. Leasing costs $0 up front and is the only route by which a federal credit still reaches a Kentucky roof, through the Section 48E pass-through for systems in service by December 31, 2027, but the lease runs 20 to 25 years, usually with a 2 to 3% annual escalator, the leasing company owns the panels, and selling the house means transferring the lease or buying it out. Get the cash price, the total paid over the life of the deal, and the transfer clause in writing before choosing.