


Indiana solar has a split personality, and the split is the whole story. On the roof, the state is ordinary in the best sense: panels cost a little more than the national average, the sun is a solid middle-of-the-pack resource, and a typical system makes just about what a typical Indiana home uses in a year. On the bill, the state is one of the hardest in the country: the export credit pays roughly a third of retail, no state program takes a dollar off the price, and the one deduction buyers used to count on was repealed in 2025. A quote that prices the hardware honestly and the exports at retail is not a quote at all — it is a 2021 proposal wearing a 2026 date, and the difference between the two is worth thousands of dollars a year in imagined savings.
That is why this guide reads the utility’s rate sheet before it reads the price. The per-watt anchor is settled and public: $2.97 a watt, a typical system of 8.34 kW, a total near $24,770. The value of what the hardware makes is settled too, but only if you know which of five utilities delivers your power, whether your system switched on before or after July 1, 2022, and how much of what the panels make your house actually uses while the sun is up. Two neighbors on the same street in Indianapolis, with the same roof and the same quote, can end up years apart on payback because one of them runs the dishwasher at noon and the other is empty until six.
The state sits a little above the national average on price and a little below it on sun. Hardware costs $2.97 a watt against $2.89 nationally, and a kilowatt of panels makes about 1,365 kilowatt-hours a year here — a respectable resource, stronger than Michigan’s, close to Ohio’s, and a long way below the desert Southwest. On price, Indiana power sits below the national average — about 16.90 cents a kilowatt-hour all-in on the 12-month average to August 2026, against 18.0 cents nationally — while the average home uses a hefty 901 kilowatt-hours a month and pays about $152. What makes Indiana distinctive is what is missing around those numbers: no state rebate, no state tax credit, no SREC market, no community solar, no reliable lease route, and a property-tax deduction that ended in 2025 while half the internet still lists it as open. The national guide above gives the countrywide baseline; what follows here is Indiana, utility by utility.
Table of Contents
How Much Do Solar Panels Cost in Indiana in 2026?
Two datasets describe Indiana in 2026, and they look like they disagree until you see what each one counts. The anchor for this guide is EcoGen’s Solar Cost Index, September 2026 edition: an Indiana install at $2.97 per watt, or about $24,770 for the typical 8.34 kW system before any incentives — of which, in Indiana, there are none. That runs 2.8% above the $2.89 national average and above every bordering state except Illinois and Michigan — Kentucky is $2.65, Ohio $2.77, Illinois $3.05, Michigan $3.09. At the anchor, 6 kW runs $17,820, 8 kW runs $23,760, 10 kW runs $29,700, and 12 kW runs $35,640.
The second dataset is the marketplace. EnergySage’s November 2026 Indiana page reads $2.59 a watt — thirty-eight cents under the EcoGen anchor — on a far larger system: its average Indiana quote is 12.41 kW at about $32,191, ranging from $27,362 to $37,020. Look at the size gap, not the thirty-eight cents: the two sources are not arguing about price at all. EnergySage averages the quotes flowing through its marketplace, and the Indiana homeowners seeking quotes there usually want large systems — big houses, big loads, big arrays. Berkeley Lab counted what actually went on roofs: a median of 8.34 kW across 119 Indiana systems installed in 2025. That median is the better picture of a typical install, so every figure in this guide builds on it. EnergySage still earns its place as the cross-check: two independent readings, $2.59 and $2.97, both in the same band and both a little above the national average.
A third reading comes from SolarReviews, working from its own data: $3.29 a watt on a 7.2 kW typical system — but its Indiana page still shows the 30% federal credit as available, which ended for systems finished after December 31, 2025, so its totals are not used here. The $3.29 figure is printed only to show why a single number, without its date and its assumptions, is worthless in Indiana in 2026.
Keep that size in mind before the tables begin, because it shapes every number that follows. The 8.34 kW median is a real installed median, not a model, and it lands almost exactly on the average Indiana home: at about 1,365 kilowatt-hours per kilowatt, 8.34 kW produces about 11,384 kilowatt-hours a year, while the average Indiana home uses about 901 kilowatt-hours a month, or roughly 10,812 a year. The typical array covers about 105% of average annual use — close enough that sizing, not price, is the decision that matters most here. And Indiana, unlike Illinois, caps the decision by law: a home system may not exceed the lesser of 1 MW or the home’s average yearly use. The sizing section works out what that size means for a household, and the net-metering section puts a price on the surplus it makes.
That per-watt figure is supposed to cover the whole job, start to finish. That figure covers the panels, the inverter or microinverters, racking and wiring, and the crew’s labor — plus permits, inspection, and the interconnection application. Roof work, a panel upgrade, tree work, a battery, and rapid-shutdown gear are all priced on top. Nothing has been taken off the arithmetic yet, because in Indiana there is nothing to take off — no rebate, no state credit, no REC payment, no property-tax deduction. The $24,770 is the price, and the payback is measured against it in full. A quote that shows a net price lower than the sticker has either invented an incentive or subtracted a dead federal credit — either way, ask for the sticker, and ask for every line that takes money off it by name.
One more warning before the tables: the cheapest quote in Indiana is rarely the cheapest system once the job is finished, and Indianapolis permitting and roof work can move the final number a long way from the headline. The dealer fee is the part of a loan quote nobody highlights: 15-30% of the cash price, sometimes more, folded into the amount financed to cover the lender’s overhead and margin. With quotes from Indianapolis, Fort Wayne, Evansville, and South Bend installers spread across the table, compare them on cash price per watt for the same panels on the same Indiana roof — that is the one number that lets you judge bidder against bidder. Collect it in writing from at least three installers, and walk away from any bidder who will not hand it over — and from any bidder who prices your exports at the retail rate, because that bidder is modeling a program that closed in 2022.
| Source | $ per watt | System | Cash total | Payback |
|---|---|---|---|---|
| EcoGen Index (Sep 2026) | $2.97 | 8.34 kW | ~$24,770 | No single figure published |
| EnergySage (Nov 2026) | $2.59 | 12.41 kW avg | ~$32,191 | 17.68 yrs — flagged, modeled |
| EnergySage Indianapolis (Nov 2026) | $2.61 | 11.65 kW avg | ~$30,443 | 18.1 yrs — flagged, modeled |
| EnergySage Evansville (Nov 2026) | $2.50 | 14.17 kW avg | ~$35,420 | 12.88 yrs — flagged, modeled |
| SolarReviews | $3.29 | 7.2 kW | ~$23,688 | Not published |
| National range (article 4) | $2.25-$3.30 | 8.2 kW | ~$24,600 at $3.00/W | 6-12 yrs |
Before you trust that table, note the warning labels on three of its rows. EnergySage’s payback figures — 17.68 years statewide, 18.1 in Indianapolis, 12.88 in Evansville — are modelled estimates built on its own marketplace averages, and they price the export credit differently from EcoGen’s per-utility method, which is why Evansville looks fast on one page and slow on another. That tension is flagged here, not resolved, and the payback section below builds the Indiana answer from the EcoGen anchors and the filed EDG rates instead. SolarReviews’ $3.29 is the stale one: a page that still subtracts a dead 30% credit cannot be trusted on the number it sits next to.
Solar Panel Cost in Indiana by System Size
Sizing comes first, and in Indiana the sizing question is governed by a law as much as by arithmetic. The problem is not that the surplus is worth nothing. It is that the typical system already produces about as much as the average home consumes, and since July 1, 2022 that surplus has earned only about five cents a kilowatt-hour. EIA billing data through August 2026 puts the average Indiana home at about 901 kilowatt-hours a month — about 10,812 a year — paying close to $152 a month for it. Put the two together and the typical array makes about 11,384 kilowatt-hours a year — roughly 105% of what the average home uses.
Building past the house’s own use is a poorer deal in Indiana than in a state with full-retail net metering, because the surplus earns only the EDG credit — about 5.43 cents at AES Indiana, against an all-in price of about 16.90 cents. An exported kilowatt-hour is worth about a third of one used at home. That gap is why the table below stops looking good past 8 kW for most Indiana homes — unless the home actually uses the power. That 8.34 kW median is exactly that case: the Indiana homes installing solar tend to be bigger, newer, and hungrier than the state average. The EcoGen anchor prices every row. At $2.97 a watt, each installed kilowatt yields about 1,365 kilowatt-hours a year. Each size shows in the last column as a share of an average home’s use, so the crossover — where the array stops feeding the house and starts selling power — is easy to see.
| Size | Cash cost at $2.97/W | Annual output | Share of a typical Indiana home’s use (10,812 kWh/yr) |
|---|---|---|---|
| 4 kW | $11,880 | ~5,460 kWh | ~51% |
| 5 kW | $14,850 | ~6,825 kWh | ~63% |
| 6 kW | $17,820 | ~8,190 kWh | ~76% |
| 7 kW | $20,790 | ~9,555 kWh | ~88% |
| 8 kW | $23,760 | ~10,920 kWh | ~101% |
| 8.34 kW (state typical) | ~$24,770 | ~11,384 kWh | ~105% |
| 10 kW | $29,700 | ~13,650 kWh | ~126% |
| 12 kW | $35,640 | ~16,380 kWh | ~152% |
Two rows deserve a closer look. First, an 8 kW system already covers about 101% of average annual use, which makes it the right size for the average Indiana home; the 8.34 kW typical system belongs to a home that uses a little more than average, or plans to. Second, Indiana caps the size by law: a home system may not exceed the lesser of 1 MW or the home’s average yearly use, so an average-use home cannot legally install a 12 kW system at all — that array makes about 16,380 kilowatt-hours a year, half again what the average home uses, and the law stops it before the arithmetic does. What the law allows is not the same as what pays: every kilowatt past the house’s own use earns the EDG credit in the months it makes the most, and there is no REC payment, no rebate, and no tax credit to cushion the oversizing mistake the way Illinois’ Shines payment partly does.
Start from a year of electric bills, not from how much empty roof you have. Twelve months of kilowatt-hours, added up and divided by about 1,365, gives the size that covers them. Then look at June, July, and August on their own: if a surplus already shows at 8 kW, stop there, because each kilowatt past that line earns only the export rate. A planned EV or heat pump adds 1-2 kW to the size; electric heat adds more, and a shaded or north-facing roof takes some away. Then check the result against your utility’s EDG credit before you sign: a system earning 5.43 cents on everything past your own use is a different investment from one earning the retail rate. An EV or a heat pump on the way means sizing the solar for the bigger house now. Size for the load first and the panels second — otherwise the new load shows up after the array is already built for the smaller house. Our sizing guide for 6, 8, and 10 kW systems walks through the full sizing job — reading twelve months of bills, knowing where to stop, and what to add for an EV or a heat pump.

Solar Panel Cost by City: Indianapolis, Fort Wayne, Evansville & South Bend
Panel prices are nearly the same in every Indiana city. What changes is the size of the system — and the size is what sets the total. Read the city table by utility first and by price second. When the bids come in, rank them on dollars per watt — the headline total on its own tells you almost nothing. An Evansville quote at the low end of its range and an Indianapolis quote at the statewide anchor are not a close call once the export credits are in: the Evansville array earns 5.561 cents on every exported kilowatt-hour at CenterPoint, and its payback is the shortest of the four, while the Indianapolis array earns 5.4325 cents at AES and waits the longest.
| City | $ per watt | Avg. system | Cash total | Utility |
|---|---|---|---|---|
| Indianapolis | $2.61 | 11.65 kW | ~$30,443 | AES Indiana |
| Fort Wayne | ~$2.75 | 8 kW planning | ~$18,920-$24,730 | Indiana Michigan Power |
| Evansville | $2.50 | 14.17 kW | ~$35,420 | CenterPoint Energy |
| South Bend | ~$2.67-$2.75 | 7.5 kW | ~$20,025 | Indiana Michigan Power |
Indianapolis is the biggest market in the state, served by AES Indiana, and the dearest per watt of the four on the EnergySage reading. EnergySage, November 2026, puts Indianapolis at $2.61 a watt on an 11.65 kW average system, about $30,443 before incentives, with a modeled payback of 18.1 years and 25-year savings of $15,660. That average system is well above the statewide median of 8.34 kW, which is the honest thing about the Indianapolis figure: Indianapolis quotes describe big systems on big houses, not the typical one. The price runs dearer for reasons that are visible from the street — city permitting, older housing stock in the inner ring that needs roof work before panels go on, and labor that costs more in the metro than downstate. In exchange, Indianapolis-based installers tend to carry the AES interconnection fluency that prevents expensive delay, and AES is where the worked payback example in this guide is built, because its rate sheet is the clearest of the five. An Indianapolis quote at $2.61 a watt is a fair price on a big system. It is not a cheap system — and at AES’s 23.2-year payback, it is the slowest of the four to earn its money back.
Fort Wayne is the city with the thinnest public pricing, and the guide says so rather than inventing a number. No EnergySage city page was found for Fort Wayne, so the figure here is a planning estimate: NumeralQ, October 2026, puts an 8 kW Fort Wayne system at $18,920 to $24,730, or about $2.36 to $3.09 a watt, and a second secondary source puts the city at about $2.75 a watt. Fort Wayne sits on Indiana Michigan Power, whose EDG credit is 5.466 cents and whose payback runs about 20.8 years on EcoGen’s figures. A Fort Wayne quote near $2.75 a watt is a fair price on a typical system. It is not a cheap system, and a Fort Wayne home that uses the state average of 901 kilowatt-hours a month has no business buying the 14 kW systems that show up in the Evansville averages — that array makes about 19,000 kilowatt-hours a year, nearly twice what the average home uses, and most of it would earn five and a half cents instead of the retail rate.
Evansville is the cheapest per watt of the four and the dearest in total — the same fact read two ways. EnergySage puts Evansville at $2.50 a watt — the lowest of the four — but on a 14.17 kW average system, about $35,420, the biggest total of the four. Evansville homes on CenterPoint run big systems for the same reason Springfield homes did in Illinois, and then some: southern Indiana gets more sun than the lake shore, the housing stock skews larger, and electric heat is more common downstate. EnergySage’s modeled payback of 12.88 years and 25-year savings of $43,500 are the rosiest of the four — and the least consistent with EcoGen’s per-utility math, which puts CenterPoint at 17.3 years, because EnergySage models its own marketplace averages rather than the filed EDG rate. An Evansville quote at $2.50 a watt is a good price on a very big system. It is not a cheap system, and an Evansville home that uses the state average of 901 kilowatt-hours a month has no business buying 14.17 kW of panels — that array makes about 19,340 kilowatt-hours a year, nearly twice what the average home uses, and the law caps the system at the home’s average yearly use in the first place.
South Bend is the northern city that prices most like Fort Wayne. Secondary sources put South Bend at about $2.67 to $2.75 a watt on a 7.5 kW typical system, about $20,025 — the smallest typical system of the four, and the cheapest total. South Bend sits on Indiana Michigan Power, the same utility as Fort Wayne, so its export credit is the same 5.466 cents and its payback runs the same 20.8 years on EcoGen’s figures. What differs is the weather: South Bend takes about 66 inches of snow a year, more than twice Indianapolis’ 25, and lake-effect cloud off Lake Michigan trims the winter production that the yearly average hides. A South Bend quote near $2.70 a watt is a fair price on a modest system. It is not a cheap system — but it is the system with the shortest winter to survive.
One last city point: installer depth is an Indianapolis thing. Many installers bid for the same Indianapolis jobs, and that competition is what pulls quotes toward $2.61 there. Past Indianapolis, longer drives and thinner competition push quotes toward the top of the band for no reason but distance. Three quotes, wherever you live — and at least one of them from a company already working in your utility’s territory.
Indiana Sunshine: Cloudy Winters, Lake-Effect Snow & the North-South Split
Winter is the season that decides an Indiana solar purchase, and any production estimate that only quotes a yearly total is hiding the hard part. The panels will make power all year, but they make it unevenly — long bright summer days, short gray winter ones — and the gap between June and December is wider here than in most of the states in this series.
Start with the yearly figure, because it is the one every quote will use. EcoGen puts Indiana at roughly 1,365 kilowatt-hours a year for each installed kilowatt, or about 4.2 peak sun hours a day across the state. Other models land lower — a PVWatts-based figure near 1,226, a second PVWatts run near 1,261 — so treat 1,365 as the generous end of the range. If an installer’s estimate sits above it, ask to see the monthly curve before you believe the yearly total.
The seasonal shape is where the yearly figure misleads. Indianapolis gets about 5.02 peak sun hours a day in summer and about 2.55 in winter, a two-fold swing from the brightest season to the darkest, and December brings the shortest days and the most cloud together. A system sized to the yearly average still bills in full through the dark months, and the surplus it banks in June earns five cents when it is exported instead of the retail rate it would have saved in January. Design for December, not for the annual average.
The lake makes the north a different climate from the south. The northwest corner of the state sits on the southern shore of Lake Michigan, and cold wind off the lake drives cloud and lake-effect snow across the whole northern tier from late November until the lake cools. South Bend averages about 66 inches of snow a year — more than twice the national average of 28 inches — the Indiana Dunes lakeshore sees near 40, Indianapolis around 25, and Evansville, at the state’s southern tip, about 11. The far south also gets more sun than the lake shore, so the same panels in South Bend and Evansville are different investments in two ways at once: one fights snow and cloud, the other does not. An installer who quotes a single statewide production number is quoting a guess.
Heat is the enemy of a solar cell, and Indiana winters are cold: output slips roughly 0.3-0.5% for each degree Celsius a cell sits above 25, so a January array runs nearer its rated output than a July one in Phoenix does. A cold, bright January day can squeeze more out of each ray than a scorching July afternoon down south. But efficiency cannot conjure daylight: December gives about nine hours of it, and cloud takes much of that.
Snow slides off a tilted array on its own, and the steeper the tilt, the faster it goes — a fixed Indiana install usually sits near the latitude tilt, around 40 degrees in Indianapolis, steep enough for most snow to clear itself after a storm. White ground in spring and fall bounces extra light onto the panels — the engineerfix estimate cited in the sources puts that lift at 15-30% — but only once the panels themselves are clear. Until snow slides, the panels earn nothing, and a low-slope roof holds it longer than a steep one. No Indiana snow-loss percentage was verified for this guide, so none is printed — ask any installer handing you a production estimate what snow loss it assumes and what tilt it is built on, and put snow guards on the quote as their own line for a steep roof, the hardware that keeps sliding snow off walkways and gutters.
The roof has to carry the winter, not just the panels. A rooftop array in Indiana carries a snow load on the racking and the roof together, heaviest where the lake-effect snow falls, and no Indiana design snow-load number was verified for this guide, so none is printed — the building department’s figure is the one that governs, and it is the one to ask for. If the roof has less than a decade in it, replace it first — pulling panels off and reinstalling them for a later reroof adds $2,000 to $4,500 to the roofing bill, and insurers often refuse to cover an array mounted on a roof past 15 or 20 years. Price the reroof before you sign, not after. Standing-seam metal suits solar better than any other Indiana roof: clamps grip the seams with no holes drilled, and snow clears off metal faster than off shingles. Whatever the roof, ask for panels rated UL 61730 / IEC 61730 by name, and get the insurer’s written word that storm damage to the array is covered before you sign.
The hardware is standard; the judgment calls are local. Point the array south where the roof allows and pitch it steep enough that snow slides and the low winter sun still lands square. Put a microinverter or optimizer on each panel so one snow-covered or shaded panel cannot choke the rest of the string. And insist on a PVWatts estimate that prints its snow assumption on the page — with the monthly curve, June next to December, not a single yearly average.
Net Metering in Indiana: Closed in 2022 — What Replaced It
People get Indiana wrong in both directions, and the correction matters more here than almost anywhere else, because the rules changed underneath the old advice. Some people claim Indiana still has net metering. That is wrong for anyone installing today. Others claim Indiana pays nothing at all for exported power. That is wrong too. What Indiana has is a successor tariff: an excess distributed generation credit priced at 1.25 times the wholesale rate, grandfathered full-retail credits for older systems, and a size cap that stops oversizing by law.
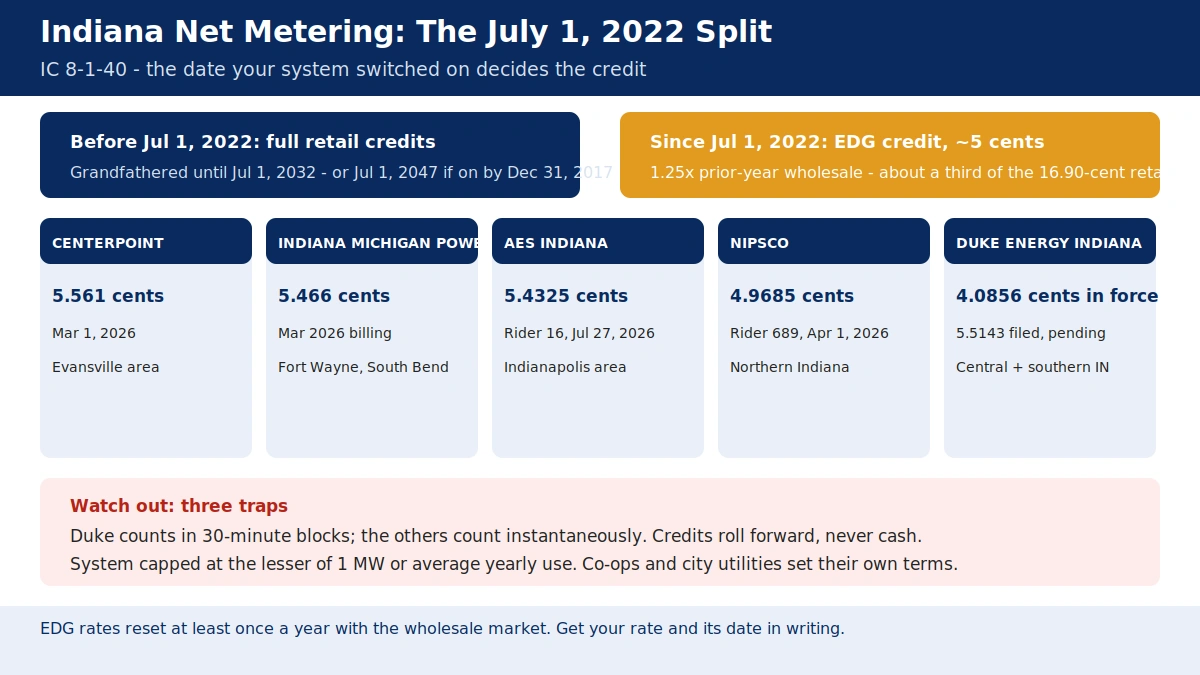
The rule. The distributed-generation statute, Indiana Code 8-1-40, binds the five big investor-owned utilities: Duke Energy Indiana, AES Indiana, NIPSCO, Indiana Michigan Power, and CenterPoint Energy Indiana South. For a home whose system was switched on before July 1, 2022, every kilowatt-hour sent to the grid is credited at the full retail rate — and those credits carry forward, grandfathered until July 1, 2032, or until July 1, 2047 for systems that were on net metering by December 31, 2017. For a home whose system is switched on since July 1, 2022, the credit is the excess distributed generation (EDG) credit: 1.25 times the utility’s average wholesale power price from the previous year. At AES Indiana that means about 5.4325 cents a kilowatt-hour on the rate sheet in force since July 27, 2026, while the retail price sits near 16.90 cents. Unused credits keep rolling forward to later bills in all five territories; they are never paid out in cash, and they vanish if the account closes.
Everything in this guide turns on that change, so it is worth stating three ways, in plain words. First, the date decides the credit, not the size of the system or the price of the panels: a system switched on June 30, 2022 earns full retail for a decade or more, and one switched on July 2, 2022 earns about five cents. Second, the EDG credit is worth about a third of the all-in price — 5.43 cents of credit against about 16.90 cents all-in — so a kilowatt-hour used at home the moment it is made is worth three times a kilowatt-hour sent out. Third, the rule binds only the investor-owned utilities: co-ops and city utilities set their own terms, and some pay little or nothing for exports, so a household on a co-op meter has to get its terms in writing before anything else.
The five rates, in force now. Each utility files its own EDG rate, and each one resets at least once a year, so the date on the rate sheet matters as much as the number. CenterPoint Energy Indiana South credits 5.561 cents a kilowatt-hour, in force since March 1, 2026 and resetting each March 1. Indiana Michigan Power credits 5.466 cents, from the March 2026 billing month. AES Indiana credits 5.4325 cents, in force since July 27, 2026 under Rider 16. NIPSCO credits 4.9685 cents, from April 1, 2026 under Rider 689. Duke Energy Indiana credits 4.0856 cents, the last approved rate — a higher 5.5143-cent rate is filed with the commission but still read “Issued: Pending, Effective: Pending” on October 19, 2026, so it is not the rate anyone is paid yet. One secondary source lists Duke at 5.5143 cents as if it were current; that is the filed rate, not the rate in force, and this guide uses the rate in force. The credit moves with the wholesale market, which resets every year — so a payback built on today’s 5.43 cents is a payback built on a number that will change, and the installer who quotes a fixed export value for twenty-five years is quoting a fiction.
How the meter counts it. AES Indiana, NIPSCO, and CenterPoint count power in and power out as it flows, instant by instant. Duke Energy Indiana counts it in 30-minute blocks — so extra power at noon does not cancel the power you buy at night, and a half-hour of heavy export followed by a half-hour of heavy use is settled as two separate numbers. The Indiana Supreme Court upheld the instantaneous-counting method in January 2023, in the case over Vectren — now CenterPoint — and the commission’s approval of it. The counting method is the second number to check after the rate itself, because it decides how much of what the panels make is ever measured as an export at all.
The size cap, and why it exists. Indiana law caps a home system at the lesser of 1 MW or the home’s average yearly electricity use. That cap is the reason the typical system lands so close to average use: the law will not let an average-use home install a 12 kW array that makes half again what the house consumes. The cap is also the reason the sizing section above stops at 8 kW for most homes — the law and the arithmetic point the same way. A system that earns five cents on everything past the house’s own use is a system that pays back on self-use alone, and the law keeps buyers from building past it.
The grandfathered household, and what can end it. If your system was on net metering before the closure, its full-retail credits stay with the system at that home — a buyer can keep them, so ask the seller for a bill that shows the terms before you buy the house. But the old terms can end early: removing or replacing the system ends them, and state guidance can count a new inverter with a different power rating as a replacement, while a repair does not count. Ask the utility in writing before you change anything on a grandfathered system — an expansion or an inverter swap that looks like maintenance can cost a decade of full-retail credits.
Indiana Incentives in 2026: What Exists and What Does Not
The federal credit is gone, and in Indiana there is almost nothing underneath it — no state rebate, no state tax credit, no REC market, no community solar, and a property-tax deduction that ended in 2025 while half the internet still lists it as open. The list below deserves a careful read, because most solar advertising in the state skips the conditions — and because the two things buyers most often count on are the two that no longer exist.
No rebate from Indianapolis, and no income-tax credit either. Indiana pays no rebate for rooftop panels from the state itself — no check from the statehouse, and none from any of the five utilities. EcoGen’s check in October 2026 found no state or utility rebate open for home solar panels in Indiana. NIPSCO’s old feed-in tariff, which once bought all of a home system’s power at a fixed price, is closed to new applicants in every category; existing contracts continue. The only money in an Indiana solar project sits on the electric bill: power used at home earns full retail, and surplus power earns the EDG credit of about five cents.
The property-tax deduction ended — and most guides have not caught up. Indiana used to give a property-tax deduction for solar power devices under IC 6-1.1-12-26: the added home value from a system was excluded from the assessment. Senate Enrolled Act 1 of 2025, signed on April 15, 2025, ended it for assessment dates on or after January 1, 2025 — including for homes that already had it. County auditors stopped applying the deduction with the property tax bills due in 2026, and the Department of Local Government Finance lists the deduction as expired. There is nothing to file, and nothing to claim. The Indiana Office of Energy Development’s page still said solar “may qualify” for property-tax deductions when EcoGen checked — that page is out of date. SolarReviews, Power Done Better, and US Solar Supplier still list the exemption as active, some of them with a form number attached. Those pages are stale. A quote that subtracts a property-tax deduction is pricing a law that no longer exists.
There is no sales-tax exemption, either — and the contract type decides what you pay. Indiana names no sales-tax exemption for solar equipment. The Department of Revenue’s Sales Tax Information Bulletin 60 sets the rule by contract type: on a lump-sum contract the installer pays tax on the materials and does not charge the homeowner sales tax; on a time-and-material contract it charges sales tax on the materials part. Ask which kind your contract is, and ask for any sales tax as its own line in the quote. Two secondary sources claim a 7% sales-tax exemption worth $2,300 to $3,200 on a typical system. That claim is contradicted by the Department of Revenue bulletin and by EcoGen’s check, so this guide does not use it.
Indiana has no SREC market and no community solar. There is no state market for solar renewable energy certificates — nothing to sell, nothing to price. And there is no community solar program at all: no law enables it. Senate Bill 541, introduced in the 2025 session, would have legalized community solar by July 2026; it did not pass. A community-energy bill, SB 196, was introduced in the 2026 session with bipartisan support; it has not passed. House Bill 1084, introduced in 2026, would have created a legal path to buy and plug in your own panels; it did not pass either. For a renter in Indianapolis or a condo owner whose roof is common area, there is no Indiana route to solar today — unlike Illinois, where community solar works through Illinois Shines.
Federal Solar for All is closed to Indiana households. That funding vanished when the EPA cancelled the program outright — all 60 grants, on August 7, 2025. In September 2026, two federal courts ruled the termination unlawful. The EPA was still weighing an appeal when this guide was written, and the program’s site showed no way for a household to apply on October 5, 2026. The money stays frozen while the courts decide, and no Indiana household can apply for it today. A separate, small nonprofit called Indiana Solar for All, run by the Center for Sustainable Living, gives grants on a sliding scale to homeowners who “pay” with 80 hours of volunteer work on installations — but its 2026 application window ran February 20 to March 15, 2026, so it is closed until the next round.
Indiana Energy Saver, the state’s HEAR portal since May 14, 2025, was still taking applications statewide at the October 27, 2026 check, and an income-eligible household can still draw up to $8,000 through it in 2026. That money is for electrification work alone. It never pays for panels. HEAR money goes to electrification gear alone. What qualifies ends there. Heat pumps qualify, and so do heat-pump water heaters, electrical panels, and the wiring that goes with insulation work. None of those four is covered: panels are out, batteries are out, EV chargers are out, and windows are out. The DOE notices behind that rule — Program Notices 26-1 and 26-2, dated May 29, 2026 and announced June 1, 2026 — limit funding to upgrades that swap one electric system for another. Fuel-switching is out. Fold a HEAR rebate into a solar price and the program you are describing is not a real one. An Indiana homeowner who pairs the two can still get HEAR help: the heat-pump side of a combined job may qualify, while the panels never do. The Indiana heat-pump numbers, including what HEAR pays there, are in our heat pump cost guide for Indiana.
| Item | Value | Notes |
|---|---|---|
| EDG bill credit (new systems) | ~4.09-5.56 cents/kWh | 1.25x prior-year wholesale; by utility; resets annually; never a check |
| IN state rebate for panels | $0 — none exists | No state or utility rebate open for home solar |
| IN state income-tax credit | None | No state solar tax credit |
| Property-tax deduction | $0 — ended Jan 1, 2025 | SEA 1 of 2025, signed Apr 15, 2025; DLGF lists it expired; OED page out of date |
| Sales-tax exemption | None | DOR Bulletin 60: depends on contract type (lump-sum vs time-and-material) |
| SREC market | None | No state REC market |
| Community solar | Not available | No enabling law; SB 541 (2025) and SB 196 (2026) did not pass |
| Federal Solar for All | $0 — no program open for IN households | EPA ended all 60 grants Aug 7, 2025; courts ruled the termination unlawful Sep 2026; funds frozen |
| Indiana Solar for All (nonprofit) | Sweat-equity grants | 80 hrs volunteer work; 2026 window Feb 20-Mar 15, 2026, closed |
| NIPSCO feed-in tariff | Closed to new applicants | Existing contracts continue |
| HEAR / HOMES rebates | Launched May 14, 2025 | Indiana Energy Saver, OED; HEAR up to $8,000 heat pump, electric-to-electric only; HOMES up to $4,000 |
| Leases / PPAs | Gray territory | DSIRE May 2026: status “unclear or unknown”; no home lease/PPA seller found |
Payback: How Long Until Indiana Solar Pays for Itself?
Payback is where an Indiana system either earns its keep or does not, and the answer turns on a fact no other state in this series shares quite this way: the sticker price is the whole price, because nothing takes money off it, and the export credit is a third of retail, because the law sets it at 1.25 times wholesale. The worked examples below start from EcoGen’s anchors, show every input, and use EnergySage only as a cross-check, with each disagreement between the two marked as it comes.
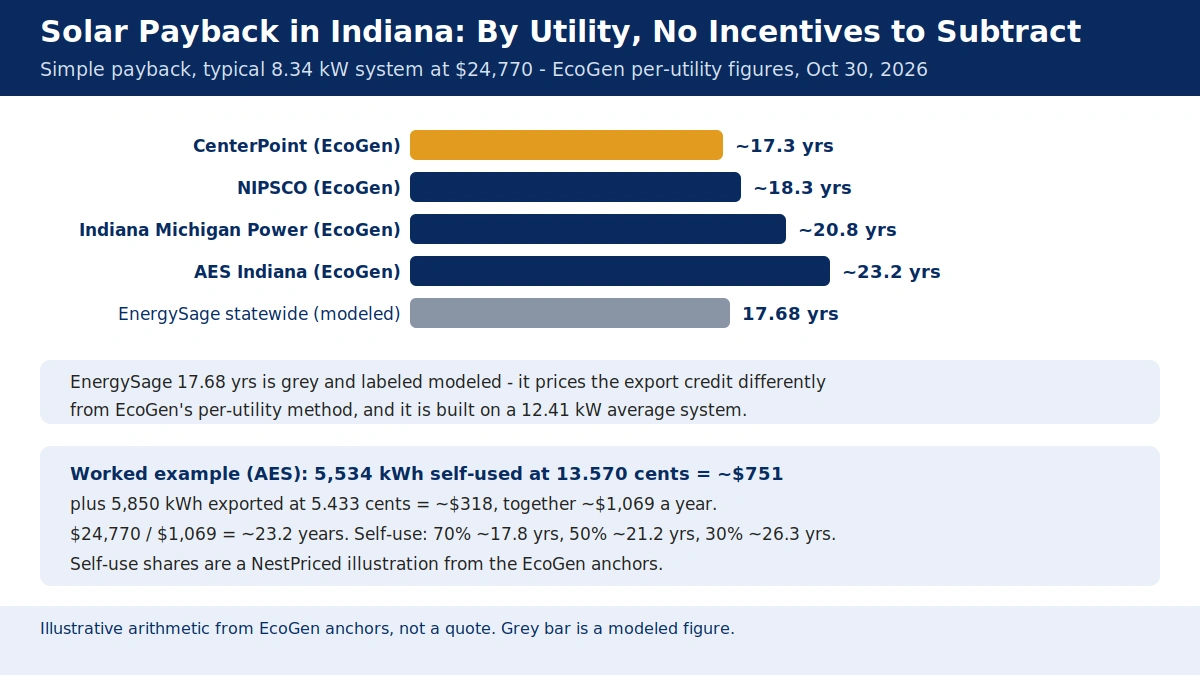
A worked example. Take the typical 8.34 kW system at $2.97 a watt — $24,770 before incentives, and after them too, because there are none. At about 1,365 per kilowatt, the typical array makes near 11,384 kilowatt-hours a year. EcoGen’s per-utility figures, from October 30, 2026, work the payback utility by utility, using each utility’s own filed rate and its own fixed charge. At AES Indiana, 5,534 kilowatt-hours are used at home as they are made, valued at 13.570 cents — the utility’s 15.427-cent all-in rate with its $17.00 monthly fixed charge taken out — worth about $751 a year; 5,850 kilowatt-hours are sent out at 5.433 cents, worth about $318 a year. Together that is about $1,069 a year, and $24,770 divided by $1,069 is about 23.2 years. The same arithmetic at CenterPoint Energy Indiana South, where the all-in rate is higher and the credit a touch higher, gives about $1,435 a year and 17.3 years. At NIPSCO, about $1,352 a year and 18.3 years. At Indiana Michigan Power, about $1,193 a year and 20.8 years. Duke Energy Indiana has no figure yet — its EDG rate is the lowest of the five and its residential rate was not verified, so no Duke payback is printed here.
The statewide figure is a range, not a number. EcoGen publishes no single statewide payback for Indiana, and it says why: the payback depends on the EDG credit, your utility’s own rate, and your home’s use. Weighted across the four utilities with figures, the state lands near 20 years. EnergySage’s modeled figures — 17.68 years statewide, 18.1 in Indianapolis, 12.88 in Evansville — are modeled estimates built on its own marketplace averages, and its Evansville figure is the one to distrust most: it is built on a 14.17 kW average system at $2.50 a watt, and it prices the export credit differently from EcoGen’s per-utility method. No verified Indiana payback sits behind any of those figures, and no quote should cite one for an AES home. The gap between 12.88 years and the illustration below is not a rounding difference — it is the EDG credit, and any payback that prices exports near retail is modeling a program that closed in 2022.
| Case | Simple payback | Source |
|---|---|---|
| EcoGen, AES Indiana ($24,770) | ~23.2 yrs | EcoGen, Oct 30, 2026 — per-utility figures |
| EcoGen, Indiana Michigan Power ($24,770) | ~20.8 yrs | EcoGen, Oct 30, 2026 — per-utility figures |
| EcoGen, NIPSCO ($24,770) | ~18.3 yrs | EcoGen, Oct 30, 2026 — per-utility figures |
| EcoGen, CenterPoint Energy ($24,770) | ~17.3 yrs | EcoGen, Oct 30, 2026 — per-utility figures |
| NestPriced illustration, 70% self-use | ~17.8 yrs | Illustration from EcoGen anchors |
| NestPriced illustration, 50% self-use | ~21.2 yrs | Illustration from EcoGen anchors |
| NestPriced illustration, 30% self-use | ~26.3 yrs | Illustration from EcoGen anchors |
| EnergySage statewide (12.41 kW) | 17.68 yrs | EnergySage, Nov 2026 — flagged, modeled |
| EnergySage Indianapolis | 18.1 yrs | EnergySage, Nov 2026 — flagged, modeled |
| EnergySage Evansville | 12.88 yrs | EnergySage, Nov 2026 — flagged, modeled |
The self-use lever, worked out here with every assumption stated. Here is the arithmetic behind the range, step by step, labelled a NestPriced illustration rather than a quote. Start with the typical system’s yearly output: 11,384 kilowatt-hours. Value a kilowatt-hour used at home at about 15.2 cents — the 16.90-cent state average with the fixed-charge share taken out, about $15 a month spread over the average home’s 10,812 kilowatt-hours — and a kilowatt-hour sent out at about 5.3 cents, the middle of the five EDG rates. Suppose the house uses 50% of what it makes the moment it is made — 5,692 kilowatt-hours at 15.2 cents, worth about $865 a year — and exports the other 50% — 5,692 kilowatt-hours at 5.3 cents, worth about $302 a year. Year one is worth about $1,167 on the bill, which puts the simple payback at $24,770 divided by $1,167 — about 21.2 years. Push the self-use share to 70% — 7,969 kilowatt-hours at home, 3,415 sent out — and the value rises to about $1,392 a year, or about 17.8 years. Drop it to 30% — a house empty all day — and the value falls to about $941 a year, or about 26.3 years. The spread between 17.8 and 26.3 years is the whole Indiana story in one paragraph: the same panels, the same price, the same roof, and nine years of difference decided by when the house uses power.
What moves the payback most. Nothing moves it like daytime self-use. In Indiana it matters more than in almost any other state, because the gap between the retail rate and the EDG credit is the widest in the series. Midday is the cheapest power an Indiana home will ever own: run the dishwasher, the washing machine, and the car charger while the panels are producing, and every kilowatt-hour they swallow is one you neither sold at 5.3 cents nor bought back at 15.2 — no other single change buys as much. At AES Indiana, each 1,000 kilowatt-hours moved from sending out to using at home is worth about $81 a year; at the state average spread it is worth about $116 a year. The utility is the second lever, and in Indiana it is a large one: the same system pays back in 17.3 years on CenterPoint and 23.2 years on AES, a gap of nearly six years decided by the name at the top of the bill. Rate escalation is the third lever, and in Indiana it is a live one: NIPSCO’s all-in residential rate runs about 23.6 cents, far above the 16.90-cent state average, and a system that looks slow at today’s rates looks faster after five more years of the same. Financing is the fourth lever. Dealer fees folded into a $0-down loan can push what you actually pay 15 to 30% above the cash price, so rank every bid on its cash dollars-per-watt and ignore the monthly payment until that comparison is done. And the timing lever is the one buyers forget: the EDG credit resets every year with the wholesale market, so a payback built on today’s 5.43 cents is a payback built on a number that will change — and no honest quote can promise which way it will go.
Who still comes out ahead. Four kinds of Indiana household still come out ahead on the numbers. The CenterPoint or NIPSCO customer, where the all-in rate is high — about 21 to 24 cents — and the payback is the shortest in the state. A household busy through the daylight hours — a home office running, laundry and dishes at midday, an EV charging while the sun is up — keeps most of what it makes at full retail value, even under EDG crediting. The household that adds panels alongside a heat pump or an EV, sizing the array to the new daytime load without building past its own use — and the heat-pump half may even draw HEAR money, since Indiana’s program is open. And the household that buys mainly for the rate rises — Indiana power is dearer in the north than the state average suggests, and a system that looks slow at today’s rates looks faster after five more years of the same. If the house stands empty all day under a north-facing roof, walk away. Walk away below 500 kilowatt-hours a month, where the fixed charges eat the savings. And walk away when the installer projects savings without naming your utility’s EDG rate and its date.
Batteries in Indiana: Storage Matters More Here Than in Most States
No add-on shows up in Indiana solar quotes more often than a battery, and none gets oversold more often. In this state it earns its keep for a reason that does not exist in a full-retail state — and any quote that sells it on another reason is selling a feeling, not a return.
What a battery costs. About $15,228 installed for a 13.5 kWh storage unit at the current national rate of about $1,128 per kWh — on top of the $24,770 for the typical 8.34 kW system, taking the combined job to about $39,998. No Indiana-specific battery price per kilowatt-hour turned up in the research, so that figure is national, and it is flagged as national. Indiana has no battery rebate to take anything off it — no state rebate, no utility rebate, nothing. Batteries get no federal credit on a 2026 owner install either: §25D covered them as well, and it ended the same day.
On the grid, a battery earns money on the spread between the export rate and the retail rate. It stores a kilowatt-hour that would have earned about 5.3 cents as an export, and releases it after dark instead of buying a kilowatt-hour at about 16.90 cents. That spread runs about 11.6 cents a kilowatt-hour at the state average — wider than Illinois’ 10.5 cents, because Indiana’s export credit is lower. A full 13.5 kilowatt-hours stored and released every day saves roughly $1.57 a day, or about $572 a year — that is NestPriced arithmetic on the state-average spread. On bill savings alone, a $15,228 battery takes about 26.6 years to pay for itself at that rate — longer than the battery will last. The spread is real but narrow, and it widens further in Indiana’s north: a NIPSCO home paying 23.6 cents all-in against a 4.97-cent export credit faces a spread near 18.6 cents, and the same battery there earns about $2.51 a day, or about $917 a year — still about 16.6 years, but close enough to a battery’s life to argue about. What the battery does recover everywhere is the evening: it moves midday production into the hours the house is actually drawing power, which lifts the value of every stored kilowatt-hour.
Think of a battery as outage insurance, not as an investment: its job is keeping the heat and the fridge running when the grid drops, not paying for itself. Indiana’s grid is generally reliable, but ice storms, summer thunderstorms, and the occasional polar-vortex cold snap do take power out, and a January outage in South Bend is a different problem from one in Evansville. Size the battery around the loads that matter in an outage — heat, refrigeration, water, medical equipment — and the house stays livable through one. Size it for the loads that matter in an outage rather than the whole house, and treat the money as insurance rather than an investment. A household that is empty all day and full all evening gets a second benefit from the same battery: it shifts midday production into the evening hours, and the savings follow. Even so, a $15,228 battery does not turn into a money-maker: the evening shift trims the payback a bit, and that is the whole of it, no matter what the sales sheet promises. Our solar battery cost guide carries the full arithmetic — the bill earnings, the rebate, and the net cost of a battery.
Federal Help in 2026: No Tax Credit — and the Lease Route Is Uncertain
One paragraph is all the federal picture needs in 2026 — which is precisely why so much solar advertising still gets it wrong. In Indiana the paragraph grows a second half most states never need, and the second half is a warning, not a door: the lease route that rescues other states is not reliably open here.
Systems placed in service after December 31, 2025 get nothing from the Residential Clean Energy Credit — §25D, 30% — because it has ended. The One Big Beautiful Bill Act, Public Law 119-21, signed July 4, 2025, drew that line. IRS fact sheet FS-2025-05 makes the finish date the deciding one. A 2025 deposit counts for nothing if the crew finished the work in January 2026. The §25C efficient-home-improvement credit ended the same day §25D did. A 2026 quote with 30% still showing is priced on a law that ended on December 31, 2025. Have the installer strip it out and price the work again. You will still find Indiana cost pages carrying a column headed “after tax credit”. That column still takes off the dead 30% credit. No figure in this guide touches it.
Leases and PPAs sit in legal gray territory in Indiana — do not count on them. Leasing companies have not lost everything everywhere. A system they own can still collect the 30% commercial clean-electricity credit under §48E, for systems in service by December 31, 2027 with construction begun by July 4, 2026, under IRS Notice 2025-42. But that route only works where a third party may legally own a system on your roof and sell you its power — and in Indiana, that question has no clear answer. DSIRE’s May 2026 map marks Indiana’s third-party PPA status as “unclear or unknown”, and a July 2025 count built on DSIRE data listed Indiana among the states with no home lease or PPA offers at all. EcoGen found no home lease or PPA seller in the state. Worse, the EDG credit itself is written for systems the customer owns: AES Indiana’s Rider 16 says the system must be owned and run by the customer, so a leased system may not earn the export credit at all. Price any lease as if the §48E value never reaches you and the EDG credit does not apply — and have a lawyer read any lease or PPA before signing, because a lease is the contract behind free-solar advertising and no program in Indiana offers free panels.
The incentives section above covers HEAR and HOMES in full; the point to carry away is narrower. Indiana’s HEAR money is live and can put as much as $8,000 toward a heat pump, yet it will not pay a dollar toward panels, a battery, an EV charger, or windows — any quote that blends a HEAR rebate into a solar price is quoting a program that does not exist.
Here is the honest summary: in 2026 the federal government contributes nothing to an Indiana homeowner who buys solar panels outright, and — unlike in Illinois, where the lease market is clear and providers are selling — it may contribute nothing through a lease or a PPA here either, because the legal route is gray and no seller was found. On a cash quote, the price is the price, less nothing. Our federal tax credits guide lays out the full 2026 federal picture. Our national solar cost guide treats lease-versus-buy in full.
Permits & Licensing: What Indiana Requires
In one respect Indiana’s licensing picture is weaker than most states’: a buyer who knows where to look finds no state-level credential to check at all, and the check that replaces it is local, uneven, and easy to skip. The check itself is short. Every installer working in the state faces the same rule.
Indiana has no state solar license, no state contractor license, and no state electrician license. The state licenses only plumbers at the state level. Cities and counties license contractors instead, so “licensed” means different things in different counties — Indianapolis and Fort Wayne–Allen County both run public license searches, and other cities and counties run their own. Ask for the city or county license number on the contract, and check it before you sign — a company that waves a general business registration instead has shown you the wrong paper. One low-quality directory claims an Indiana Professional Licensing Agency electrical contractor license exists; EcoGen’s check of the public records in October 2026 found no state license for this work, and this guide follows the records. Ask for a second credential, the one that decides whether the wiring is legal: the license of the electrician who will actually connect the system, named on the contract. And ask for the third and fourth: proof of liability insurance, and recent local references from the last twelve months. AES Indiana asks for proof of liability insurance and a licensed electrician’s sign-off before it connects a system; the utility installs the meter at its own cost. NABCEP certification is a plus, not a requirement.
Permits and interconnection are the slow part of the job. That timeline is what sets the schedule. The job needs three approvals, taken in this order — the building permit, the electrical permit, and the utility’s agreement to interconnect. Of the three, the permits are usually the fast part in the suburbs and the slow part in Indianapolis, where the city runs the process and older housing stock slows it down. Interconnection takes longer. Each of the five utilities runs its own interconnection queue under the same state law, and delay is a cost even when it never appears as a line item. No verified Indianapolis permit timeline, no statewide schedule of permit fees, and no verified utility interconnection timeline turned up for this guide. The fee comes from the city or county building department, and the snow-load figure that governs the roof comes from there too. Every new home install carries rapid shutdown to NEC 690.12 as standard — if a quote leaves it out, ask why. Permission to operate inside two weeks is not a promise any installer can honestly make. The utility sets that timetable. It is not the installer’s call. CenterPoint sends a Permission to Operate after it installs the meter; do not switch the system on before you have it.
Indiana has a solar-access law, and it is narrower than Illinois’. The Homeowners Associations Act, IC 32-25.5-3.5, added by House Enrolled Act 1196 in 2022, limits what an association may do about a solar energy system — but it does not ban prohibitions the way Illinois’ law does. Under it, an association may prohibit a system or require its removal only for an enumerated reason: a court finding of a health, safety, or legal violation; placement on HOA-owned or common property; or a roof mount that extends more than six inches above the roof, does not follow the roof’s slope, or uses off-tone hardware — frames, brackets, and visible piping and wiring outside silver, bronze, or black tones. Where the governing documents already restrict solar, a homeowner may petition the membership for approval: gather signatures equal to the lesser of the number needed to amend the covenants or 65% of members, present the plan to the board, and the board may not deny it if the requirements are met. The protection binds associations established after June 30, 2009 with mandatory dues, or older ones that elected in — and a 2026 amendment, HEA 1115, extended several HOA Act provisions to all associations from July 1, 2026, though whether the solar chapter is among them was not confirmed for this guide, so check whether your association is covered before you rely on it. Do not order panels until the architectural-review approval is in writing. For a condo owner the hurdle is doubled: the roof is usually common area, so the board’s approval is the whole decision — and a system on common property is one of the enumerated reasons an association may say no.
The cautionary case is national, but the moral is Indiana’s. A door-to-door pitch deserves caution. Look the company up in the Attorney General’s complaint record before you sign anything, and treat the biggest advertising budget in the state as no guarantee the firm will still be around in five years.
What Pushes Your Indiana Quote Up or Down
The per-watt anchor is where the pricing starts, not where it has to land. No quote is bound to land on $2.97, and the reasons a quote lands above or below it are mostly visible before the crew arrives — in the roof, the city, the equipment, and the way the job is paid for.
The roof decides the labor. Indiana housing stock is old enough that structural surprises are a budget line, not a footnote, and the state has plenty of steep, multi-plane roofs that add labor hours while fitting fewer panels on the best-facing side. Add a roof with under a decade left and the bill grows again: a reroof before the panels go on is the right order, and taking panels off and putting them back later runs $2,000 to $4,500 on top of the roofing job. Get the reroof priced before you sign anything — the reroof numbers live in our roof replacement guide. Standing-seam metal is the friendliest roof in the state for solar: clamps fasten to the seams with no holes at all, and snow sheds off metal well before it leaves shingles. Snow guards belong on a steep roof’s quote as their own line — the hardware that keeps sliding snow off walkways and gutters. Ask the building department for the roof’s snow-load rating before installation day — after is too late. Freeze-thaw cycles chew through flashing and shingles all winter long, a beating southern roofs never take, and a roof that holds snow for weeks carries a load no summer roof ever has to bear — heaviest in South Bend, where 66 inches a year is the normal.
The city decides the soft costs. Indianapolis permitting, older inner-ring housing stock that needs roof work before panels go on, and metro labor rates all push a city quote up, and an Indianapolis quote ought to list permitting and roof work as separate lines — if they are missing, they are buried somewhere else in the total. No Indiana wage for electricians turned up in the research, so this guide prints none; the national median is about $30.38 an hour (BLS, May 2025), for scale. What moves the price is not the hourly rate but the crew: Indianapolis has plenty of installers, the rest of the state has few, and a crew that already knows your utility’s interconnection queue is worth more than a low hourly figure. Ask which roof face the panels go on, how the racking fastens, and what happens to the schedule if the roof needs work first.
The equipment decides the output. Top-tier panels run roughly a tenth to a fifth dearer per watt than value-tier ones, and in Indiana the premium buys two things worth having: better low-light performance on cloudy winter days, and slower degradation across a quarter century of cold, bright sun. Premium n-type panels shed 0.25-0.5% a year and still deliver 91-93% of rated output at year 25, against a fleet median near 0.5% a year and about 88% at year 25 (NREL). Efficiency pays off on a tight roof; on a wide-open roof in southern Indiana, cheaper value-tier panels usually win. The inverter is the same kind of choice. A string inverter is the cheaper buy; microinverters or optimizers cost more yet squeeze more out of a partly shaded roof. Indiana roofs carry shade more often than installers admit — trees, dormers, chimneys — and snow sitting on one part of an array shades it the same way a tree does. Each microinverter minds only its own panel, so one shaded or snow-covered panel cannot pull the rest of the string down with it. Plan on replacing a string inverter once during the system’s life — they usually last 10-15 years — while microinverter warranties usually run near 25 years. The inverter guide prices every type across its whole lifespan — see our inverter replacement guide — and the dollar figures there are national, not Indiana, ones.
A solar install often forces the question in Indiana, where plenty of homes still run on 100-amp service — older homes in Indianapolis, Fort Wayne, and the inner-ring suburbs especially. Per our electrical panel upgrade guide, a 200-amp panel upgrade runs $1,500-$4,000 nationally, and it is the add-on that catches Indiana buyers off guard most often. Make the quote state whether the panel upgrade is included, and settle it before the electrician is standing in the driveway. No Indiana-only price for a panel upgrade turned up, so the national figure stands in, marked as national. One point in your favor: a panel upgrade is electrification work, the sort HEAR exists to fund, and Indiana’s HEAR program is open — an upgrade tied to a heat pump may qualify.
The payment method decides the lifetime cost. Cash wins. Every other way of paying costs more over the years, and on a $0-down loan the dealer fee — 15-30% of the cash price, sometimes more than 50%, folded into the amount financed — is the quiet part of the quote. That is the Consumer Financial Protection Bureau’s August 2024 market spotlight, a national figure that Indiana quotes carry in full. In Indiana the dealer fee can quietly exceed everything the paperwork wins, because there is no incentive money to offset it: the financed total is larger than the cash price by the fee alone, and nothing else takes money off. A lease or PPA is the fourth path, and in Indiana it is not a clear one — the law’s status is gray, no home seller was found, and the EDG credit is written for systems the customer owns. Community solar is the fifth path in most states, and in Indiana it does not exist: no law enables it, and the bills that would have created it did not pass.
A panel keeps producing for 25-30 productive years. The warranty runs out first, and output slips a little each year after that. Workmanship and materials usually carry 10-25 years of warranty; the performance warranty usually runs 25-30 years and promises 80-92% of rated output at year 25, the exact figure depending on the tier. Upkeep is light: an occasional cleaning and a yearly production check are the whole job, since nothing moves and nothing wears out. A steep array usually clears its own snow; a low-slope roof holds it longer, and a spring rinse does what rain does not. All of those lifespan, degradation, and maintenance figures are national data — no Indiana version of any of them exists — so each one is flagged as national.
Buying a Home With Panels in Indiana: Grandfathered Credits Transfer
A house with panels already on the roof is a different purchase from a house without them, and in Indiana the difference is worth real money — because the old net-metering terms stay with the system at that home. A buyer who inherits them keeps full-retail credits for years after a new system would earn five cents. A buyer who does not know they exist pays the same price for a house worth less.
The terms stay with the house, not the owner. Homes that joined net metering before their utility closed the program keep full credits for a set time, and the terms stay with the system at that home, so a new owner can keep them. A system that was on net metering by December 31, 2017 keeps full-retail credits until July 1, 2047. A system that joined later, before the utility closed the program, keeps them until July 1, 2032. A system connected after the closure never gets them: it earns the EDG credit, like any new system. Before you buy, ask the seller for a bill that shows the net-metering terms — the bill is the proof, and a seller who cannot produce one may not have the terms at all.
What can end the old terms early. Removing or replacing the system ends the grandfathered terms. State guidance can count a new inverter with a different power rating as a replacement, while a repair does not count. That distinction matters at the inspection: a system with a failing inverter is not a bargain if the fix that saves it costs the credits that made it valuable. Ask the utility in writing before you change or add panels on a grandfathered system, and get the answer in writing before you close. An expansion that looks like a simple add-on can reset the whole system to the EDG credit.
Price the house with the credits in it. A grandfathered system on an AES bill earns about 16.90 cents on every exported kilowatt-hour; the same system installed new earns 5.4325 cents. On a typical array exporting half its output — about 5,692 kilowatt-hours a year — that gap is worth about $654 a year, every year until 2032 or 2047. Over the remaining grandfathered years, that is thousands of dollars of bill value that a new system cannot reproduce. A seller who knows the terms will price them in; a buyer who does not know them will not. Read the bill, date the terms, and pay for what the roof actually earns.
Getting Quotes in Indiana: The Checklist
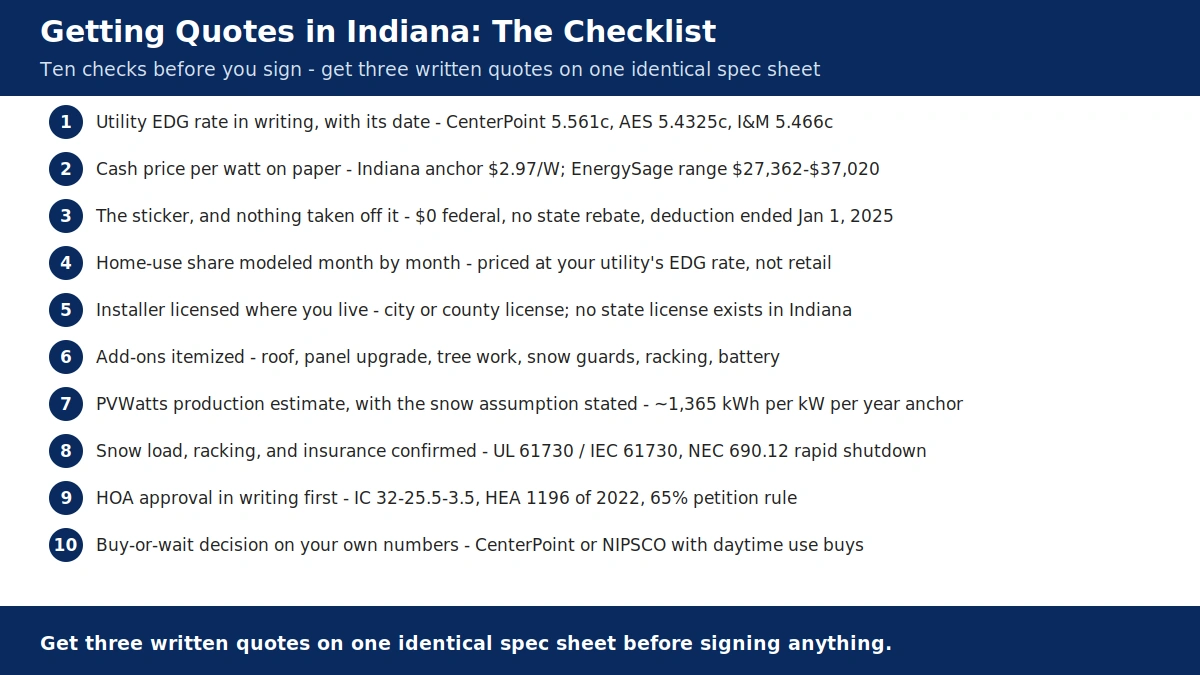
Indiana is a hard state to buy solar in — no rebate, no tax credit, no REC market, no community solar, and an export credit worth a third of retail — but only for a homeowner who does not check the paperwork before the sales pitch. The sticker is the price, and the export credit is the payback. Bring this checklist to every bidder meeting. Nothing gets signed until every item carries an answer in writing.
The ten-item quote checklist:
- Your utility’s EDG rate, in writing, with its date — CenterPoint’s 5.561 cents, AES’s 5.4325 cents, I&M’s 5.466 cents, NIPSCO’s 4.9685 cents, or Duke’s 4.0856 cents in force, and whether your meter counts instantaneously or in 30-minute blocks. Before anything else, the export credit and the July 1, 2022 change decide the payback — and a pre-2022 system’s grandfathered full credits are worth more than any rebate that does not exist.
- The cash dollars-per-watt, written down, on a single spec sheet shared with all three bidders. At $2.97 a watt sits the Indiana anchor; a quote far above it calls for an explanation, and a quote far below it calls for a closer look at what was left out.
- The sticker, and nothing taken off it — no 30% federal credit line, no state rebate line, no property-tax deduction line, no sales-tax exemption line. A 2026 owner purchase receives $0 from Washington and $0 from Indianapolis. The deduction ended for assessment dates from January 1, 2025, and the federal credit ended for systems finished after December 31, 2025. A quote that subtracts either one rests on a law that has already expired. Ask for both lines to be removed.
- Your home-use share, modeled month by month — for each month, work out how much of what the panels make the house uses the moment it is made, and price the rest at your own utility’s EDG rate. Any bid that values every exported kilowatt-hour at the full retail rate is wrong, and so is one that lets June’s surplus pay January’s bill at retail. Check the size against the legal cap, too: the lesser of 1 MW or your average yearly use.
- The installer, licensed where you live — the city or county license number on the contract, the electrician who will wire the system, proof of liability insurance, and recent local references from the last twelve months. Indiana has no state solar, contractor, or electrical license, so the city or county paper is the only paper there is. NABCEP certification is a plus.
- Add-ons priced on their own — roof work, panel upgrade, tree work, snow guards, racking, and battery, never folded into the per-watt figure. Check whether the contract is lump-sum or time-and-material, because that decides whether sales tax appears on the materials part.
- A PVWatts estimate that shows its snow assumption — ask for the monthly shape, not one yearly average, built on roughly 1,365 kilowatt-hours per kilowatt. Insist on the monthly curve itself, June next to December, and ask whether the estimate uses Indianapolis’ 4.21 peak sun hours or the lake shore’s cloudier figure — the two are not the same roof.
- Snow load, racking, and insurance confirmed — ask the building department for the roof’s snow-load rating, name the racking’s uplift rating and the tilt, and get the insurer’s written word on storm cover.
- HOA approval, in writing, first — Indiana’s solar-access law (IC 32-25.5-3.5, added by HEA 1196 in 2022) limits an association to enumerated reasons for refusing a system, and lets a homeowner petition the membership with signatures equal to the lesser of the amendment threshold or 65% of members; the association may still refuse a roof mount more than six inches above the roof, one that does not follow the roof’s slope, or off-tone hardware. Before the panels are ordered, get the architectural-review approval in hand; condo owners also need board approval for the common-area roof.
- The buy-or-wait decision, made on your own numbers — a CenterPoint or NIPSCO home with high daytime use buys; a house empty all day on AES at 23.2 years waits, or buys smaller. If the installer cannot name your utility’s EDG rate and its date, cannot model your monthly self-use, or cannot show a city or county license, the quote is not ready to sign.
Buy, wait, or walk away? Over 25 years, buying wins for a homeowner who uses a lot of power in daylight, sits on CenterPoint or NIPSCO where the all-in rate is high, or pairs the array with a heat pump or an EV — and the heat-pump half may draw HEAR money, since Indiana’s program is open. Buy it outright, and the system is yours, the resale value is yours, and every kilowatt-hour you use yourself is worth its full retail value. Waiting suits a homeowner on AES at 23.2 years whose house is empty all day, whose roof faces north, or whose roof needs replacing first — the panels will still be there in a year, and the price may be lower. Walking away suits a renter, a condo owner with a common-area roof, or a home on a co-op meter whose export terms are worse than the EDG credit — and in Indiana, unlike Illinois, there is no community solar door to walk through instead. Off the grid, past the end of the road, a cabin is a different question entirely — and one this guide leaves alone. A rural Indiana home on a co-op meter needs that utility’s own terms in writing before anything else.
Sources & methodology
Cost anchors (per watt, system size, totals):
- EcoGen Solar Cost Index, September 2026 Edition, prices as of Sep 25, 2026 (page updated Oct 19, 2026): $2.97/W; 8.34 kW typical (Berkeley Lab 2025 median, 119 systems); $24,770 total; neighbors KY $2.65, OH $2.77, US $2.89, IN $2.97, IL $3.05, MI $3.09
- EnergySage Indiana page, Nov 2026: $2.59/W; 12.41 kW average; $32,191 (range $27,362-$37,020); payback 17.68 yrs; 25-yr savings $18,818 — modeled, flagged
- EnergySage city pages, Nov 2026: Indianapolis $2.61/W, 11.65 kW, $30,443, payback 18.1 yrs, savings $15,660; Evansville $2.50/W, 14.17 kW, $35,420, payback 12.88 yrs, savings $43,500
- Fort Wayne: NumeralQ planning estimate, Oct 26, 2026: 8 kW $18,920-$24,730 ($2.36-$3.09/W), flagged as planning estimate; solarcostbyzip Sep 2026 $2.75/W
- South Bend: solarpricebystate $2.67/W, 7.5 kW, $20,025; solarcostbyzip Sep 2026 $2.75/W, range $11,000-$32,900 — secondary sources, flagged
- SolarReviews Indiana $3.29/W: excluded — page still shows the 30% federal credit as available
- EnergyScout, Sep 2026: Indiana #40 residential solar, #10 utility-scale, 3,500+ MW total capacity; typical system ~$32,729 at $2.75/W for 11.9 kW (EnergySage Sep 2026 marketplace data)
Rates and home use:
- EIA, 12 months to Aug 2026: IN 16.90 cents/kWh (US 18.0 cents); average use 901 kWh/mo (~10,812 kWh/yr); average bill ~$152/mo; Aug 2026 alone 17.02 cents (solarpanelscost, EIA Electric Power Monthly)
- Per-utility residential rates (EIA 12-mo, EcoGen): AES Indiana 15.427 cents all-in, $17.00/mo fixed → 13.570 cents variable; NIPSCO 23.596 cents, $14.00 → 21.443 cents; CenterPoint Energy Indiana South 21.349 cents, $11.32 → 20.062 cents; I&M 16.777 cents, $15.00 → 14.965 cents; Duke Energy Indiana residential rate not verified — none stated
- Five IOUs serve ~73% of homes; Duke largest at 27% (EcoGen, EIA-861 2024)
Production:
- EcoGen-implied ~1,365 kWh/kW/yr (8.34 kW → 11,384 kWh/yr); cross-checks: sunmetriclab ~1,226 (8 kW → 9,810 kWh, Sep 10, 2026); sparkpowered PVWatts v8 ~1,261; elovane ~1,180; energyguideusa range 1,200-1,400
- Peak sun hours ~4.2/day statewide (NREL); Indianapolis summer 5.02, winter 2.55, year 4.21 (NREL table); Gary fixed-tilt 4.4 hrs/day; 186 sunny days/yr (indianastatesolar)
Net metering and EDG credits:
- SEA 309 (2017), IC 8-1-40; net metering closed to new systems no later than Jul 1, 2022 (CenterPoint earlier, May 14, 2021); EDG credit = 1.25x prior-year average wholesale/marginal price (IC 8-1-40-17)
- 2026 EDG rates in force: CenterPoint 5.561 cents (Mar 1, 2026); AES 5.4325 cents (Rider 16, Jul 27, 2026); I&M 5.466 cents (Mar 2026 billing month, Rider EDG Second Revised Sheet 41.8); NIPSCO 4.9685 cents (Rider 689, Apr 1, 2026); Duke 4.0856 cents in force (Feb 27, 2025); Duke 5.5143 cents filed, pending — not in force
- Grandfathering: on net metering by Dec 31, 2017 → full credits until Jul 1, 2047; joined later before closure → until Jul 1, 2032; terms stay with the home; removal/replacement ends terms early; new inverter with different power rating can count as replacement; repair does not count
- Metering: AES, NIPSCO, CenterPoint instantaneous; Duke 30-minute blocks; I&M method not verified — none stated; Indiana Supreme Court Jan 2023 upheld IURC approval of instantaneous netting (Vectren/CenterPoint case)
- System-size cap: lesser of 1 MW or average yearly use (IC 8-1-40); credits roll forward, never a check, lost on account close; co-ops and municipal utilities set their own terms
- DSIRE May 2026 map: Indiana net billing / successor tariff; third-party PPA status “unclear or unknown”
Payback arithmetic:
- EcoGen per-utility figures, Oct 30, 2026 (8.34 kW, $24,770): AES 23.2 yrs ($1,069/yr; 51.4% sent out); I&M 20.8 yrs ($1,193/yr; 47.2%); NIPSCO 18.3 yrs ($1,352/yr; 58.1%); CenterPoint 17.3 yrs ($1,435/yr; 51.4%); weighted Indiana ~20.1-20.3 yrs; Duke no figure yet
- EnergySage modeled paybacks (17.68 yrs statewide; 18.1 Indianapolis; 12.88 Evansville) flagged as modeled estimates; Evansville figure built on a 14.17 kW average system and prices the export credit differently from EcoGen’s per-utility method
- NestPriced illustration (labeled as such): 8.34 kW, $24,770, 11,384 kWh/yr; self-use valued at ~15.2 cents (16.90 cents minus fixed-charge share), exports at ~5.3 cents blended; 50% self-use → ~$1,167/yr → ~21.2 yrs; 70% self-use → ~$1,392/yr → ~17.8 yrs; 30% self-use → ~$941/yr → ~26.3 yrs
- Battery illustration: 13.5 kWh/day at ~11.6-cent spread = ~$1.57/day, ~$572/yr; $15,228 battery = ~26.6 yrs on bill savings alone (national $/kWh); NIPSCO spread ~18.6 cents → ~$2.51/day, ~$917/yr → ~16.6 yrs
- AES self-use lever: each 1,000 kWh moved from export to self-use worth ~$81/yr (13.570 cents − 5.433 cents); state average spread ~11.6 cents → ~$116/yr per 1,000 kWh
Production and climate:
- South Bend 66 in snow/yr (1991-2020 normals, usclimatedata; NWS normal 64.5 in; 2022 total 91.8 in; 2024 total 36.3 in); Indiana Dunes lakeshore 40.3 in; Indianapolis ~25 in/yr; Evansville ~11 in/yr (1991-2020 normals); Fort Wayne snowfall not verified — none stated
- Snow albedo boost estimated 15-30% spring/fall (engineerfix, cited estimate)
- Heat penalty 0.3-0.5% per degree C above 25 C cell temperature, national figure
- Detach-and-reset for a later reroof $2,000-$4,500 (national figure)
Incentives:
- No state rebate, no state income-tax credit; no SREC market; no sales-tax exemption (DOR Sales Tax Information Bulletin 60 — lump-sum vs time-and-material)
- Property-tax deduction (IC 6-1.1-12-26) ended: SEA 1 of 2025, signed Apr 15, 2025, for assessment dates from Jan 1, 2025, including homes that had it; DLGF memo Jun 12, 2025 lists the deduction as expired; OED page still says solar “may qualify” — out of date; SolarReviews / Power Done Better / US Solar Supplier still list the exemption as active — stale
- NIPSCO feed-in tariff closed to new applicants in all categories; existing contracts continue
- Community solar: no enabling law; SB 541 (2025) would have legalized it by Jul 2026 — did not pass; SB 196 (2026, bipartisan) introduced, not passed; HB 1084 (2026) plug-in solar — did not pass
- Federal Solar for All: EPA terminated all 60 grants Aug 7, 2025; courts ruled the termination unlawful Sep 2026; EPA weighing appeal; Solar Opportunities Indiana site showed no household application path Oct 5, 2026
- Nonprofit Indiana Solar for All (Center for Sustainable Living): sweat-equity grants, 80 hrs volunteer work; 2026 window Feb 20-Mar 15, 2026, closed
- HEAR/HOMES: LAUNCHED in Indiana — Indiana Energy Saver (indianaenergysaver.com), OED, May 14, 2025; applications open statewide (checked Oct 27, 2026, ECW; Jul 11, 2026, Retrofit Relay); allocations HEAR $90,772,430 / HOMES $91,118,593; HOMES up to $4,000 general, more income-qualified; HEAR up to $8,000 heat pump
- Leases/PPAs: DSIRE May 2026 “unclear or unknown”; July 2025 count listed Indiana among states with no home lease or PPA offers; EcoGen found no home lease/PPA seller; AES Rider 16 covers customer-owned systems only
Federal and financing:
- OBBBA P.L. 119-21 and IRS FS-2025-05: §25D and §25C $0 for post-Dec-31-2025 installs, completion date counts
- §48E 30% for third-party-owned systems, in service by Dec 31, 2027, construction begun by Jul 4, 2026 per IRS Notice 2025-42 — route uncertain in Indiana (see above)
- DOE Program Notices 26-1 and 26-2, dated May 29, 2026, announced Jun 1, 2026: HEAR electric-to-electric upgrades only, no fuel-switching; solar, batteries, EV chargers, windows outside HEAR
- CFPB Solar Financing Market Issue Spotlight, Aug 2024: dealer fees 10-30%, sometimes over 50%
- Battery cost: 13.5 kWh add-on ~$15,228 at national ~$1,128/kWh; battery daily-savings illustrations (~$1.57/day, ~$572/yr statewide; ~$2.51/day, ~$917/yr at NIPSCO) are NestPriced arithmetic from the retail-minus-EDG spread, labeled as illustrations
HOA and licensing:
- Homeowners Associations Act, IC 32-25.5-3.5 (HEA 1196, 2022): association may prohibit or require removal only for an enumerated reason — court finding of health/safety/legal violation; common property; roof mount more than 6 inches above the roof, not following the roof’s slope, or off-tone hardware (silver, bronze, or black only); petition process with signatures equal to the lesser of the amendment threshold or 65% of members; denial prohibited if requirements met (§32-25.5-3.5-4); binds associations established after Jun 30, 2009 with mandatory dues, or older ones that elected in; HEA 1115-2026 extended several provisions to all HOAs effective Jul 1, 2026 — whether Ch. 3.5 is among them not confirmed
- No state solar, contractor, or electrical license in Indiana (EcoGen, checked Oct 14, 2026); city/county licenses instead; Indianapolis and Fort Wayne-Allen County have public license searches; AES asks for proof of liability insurance and a licensed electrician’s sign-off
- Interconnection under IC 8-1-40; NEC adopted in Indiana; NEC 690.12 rapid shutdown standard (national practice)
- No verified Indianapolis permit timeline, permit-fee schedule, or utility interconnection timeline — none stated
Labor and lifespan (national figures):
- BLS OEWS May 2025: electricians national median $30.38/hr (no Indiana-specific figure pulled)
- Lifespan 25-30 years productive service; NREL median degradation ~0.5%/yr, ~88% of rated output at year 25; premium n-type 0.25-0.5%/yr, 91-93% at year 25 (NREL Jordan et al. 2022)
- Product warranty typically 10-25 years; performance warranty typically 25-30 years, guaranteeing 80-92% of rated output at year 25 depending on tier; string inverter 10-15 years, one replacement expected; microinverters ~25 years
EXCLUDED:
- Any “after 30% credit” prices (SolarReviews $3.29/W page still shows the credit)
- Any HEAR-for-solar claim: HEAR does not cover solar, batteries, EV chargers, or windows; electric-to-electric only since DOE Notices 26-1/26-2, May 29, 2026
- Any state rebate, state tax credit, SREC market, or community solar for Indiana: none exists
- Any property-tax deduction or 7% sales-tax exemption: the deduction ended Jan 1, 2025 (SEA 1 of 2025); no sales-tax exemption exists (DOR Bulletin 60)
- Duke Energy Indiana EDG 5.5143 cents as current: filed, not in force; 4.0856 cents used
- EnergySage’s 17.68-year statewide payback as verified: modeled, built on 12.41 kW marketplace averages; Evansville 12.88 yrs prices the export credit differently from EcoGen’s per-utility method
- Community solar / plug-in solar as available: not law in Indiana (SB 541, SB 196, HB 1084 all failed or pending)
- The §48E lease route as available in Indiana: gray territory, no seller found, EDG credit written for customer-owned systems
- Indiana-specific battery $/kWh, design snow load, monthly PVWatts table, snow-loss percentage, BLS electrician wage, panel-upgrade price, permit-fee schedule, permit/interconnection timelines, Fort Wayne snowfall, I&M metering method, Duke residential rate and payback, HEA 1115-2026 coverage of Ch. 3.5: not verified, national figures used and flagged as national
*Disclaimer: The prices here are 2026 Indiana planning figures. Your town, your utility, the state of your roof, and the installer you pick each shift what the job finally costs. Settle the budget only after three Indiana installers have put their prices in writing. Read every tax note here as general background, not guidance shaped to your own return. Have an Indiana-licensed tax professional review your return before you file it. Program rules change — EDG credit rates reset at least once a year and the federal rebate programs can change — so confirm current terms with your own utility and your installer before signing.*
What do solar panels cost in Indiana in 2026?
In Indiana in 2026, solar panels install at $2.97 a watt — about $24,770 for the typical 8.34 kW system (EcoGen, September 2026) — with 2026 quotes spanning roughly $27,000 to $37,000 for the larger systems EnergySage tracks. A typical 8 kW home system runs about $23,760 — $2.97 a watt on the EcoGen anchor — while EnergySage puts the state average at $2.59 a watt, on a bigger 12.41 kW system. A homeowner-owned system installed in 2026 earns a $0 federal credit, Indiana offers no state rebate and no state income-tax credit, and the property-tax deduction ended for assessment dates from January 1, 2025 — so the $24,770 sticker is the price, and payback runs about 17 to 23 years depending on the utility.
Is solar worth it in Indiana with the export credit so low?
Closer than the five-cent credit suggests — the answer turns on which utility serves the house and when the house uses power. Each kilowatt of panels makes about 1,365 kilowatt-hours a year here — a solid middle-of-the-pack resource — while the power it replaces runs about 16.90 cents a kilowatt-hour on the 12-month average, and NIPSCO customers pay about 23.60 cents all-in. On EcoGen’s per-utility figures, payback runs about 17.3 years on CenterPoint and about 23.2 years on AES, with no incentives to shorten either one. A home that uses 70% of what it makes in daylight finishes in about 17.8 years on NestPriced’s illustration; a home that is empty all day takes about 26.3 years. CenterPoint territory, with the highest all-in rate and the highest export credit, is the fastest of the big utilities; AES territory, in Indianapolis, is the slowest.
How does net metering work in Indiana?
It closed to new systems on July 1, 2022, and what replaced it pays far less. Under Indiana Code 8-1-40, homes whose systems were switched on before the closure keep full-retail bill credits — until July 1, 2032, or July 1, 2047 for systems on net metering by December 31, 2017. Homes that switch on since then earn an excess distributed generation credit worth 1.25 times the utility’s prior-year average wholesale price: about 5.561 cents a kilowatt-hour at CenterPoint, 5.466 cents at Indiana Michigan Power, 5.4325 cents at AES Indiana, 4.9685 cents at NIPSCO, and 4.0856 cents at Duke Energy Indiana. Unused credits roll forward to later bills and are never paid out in cash. AES, NIPSCO, and CenterPoint count power in and out instantaneously; Duke counts it in 30-minute blocks.
Are there any solar incentives left in Indiana in 2026?
Almost none, and two of the ones buyers most often count on no longer exist. Indiana pays no state rebate for rooftop panels, no state income-tax credit, and has no SREC market and no community solar program. The property-tax deduction ended for assessment dates from January 1, 2025, under Senate Enrolled Act 1 of 2025 — signed April 15, 2025 — and county auditors stopped applying it with the tax bills due in 2026, even though many guides still list it as open. There is no sales-tax exemption for solar equipment either. What is left is the EDG bill credit for power sent to the grid, and the federal HEAR and HOMES rebates — which are open in Indiana, unlike Illinois — but those pay for heat pumps, panels, and wiring, never for solar panels themselves.
Is the 30% federal solar tax credit still available to Indiana homeowners in 2026?
Not for a system you own. The Residential Clean Energy Credit — the 30% credit under §25D — is finished for homeowner-owned systems. Anything placed in service after December 31, 2025 earns none of it. The One Big Beautiful Bill Act (P.L. 119-21) drew the line there, and the IRS has made clear that the finish date of the installation is what decides it, not the date the deposit was paid. Indiana offers no second door of the kind some states have: leases and power purchase agreements sit in legal gray territory here, DSIRE’s May 2026 map marks the state’s third-party PPA status as “unclear or unknown,” no home lease or PPA seller was found, and the EDG credit is written for systems the customer owns — so do not count on a lease to recover the federal value.
Do I need a special license to install solar in Indiana?
Your installer does not need a state one, because Indiana has none — and that is exactly why the local check matters. No state-level solar, contractor, or electrician license exists here; the state licenses plumbers only. Cities and counties license contractors instead, and Indianapolis and Fort Wayne–Allen County both run public license searches. Ask for the city or county license number on the contract, the license of the electrician who will actually wire the system, proof of liability insurance, and recent local references from the last twelve months. AES Indiana asks for proof of liability insurance and a licensed electrician’s sign-off before it connects a system. A NABCEP certificate helps a bidder stand out, but the law does not demand one.
Can my HOA stop me from installing solar panels in Indiana?
Sometimes, but not for any reason it likes. Under the Homeowners Associations Act (IC 32-25.5-3.5, added by House Enrolled Act 1196 in 2022), an association may prohibit a solar energy system or require its removal only for an enumerated reason — a court finding of a health, safety, or legal violation, placement on HOA-owned or common property, or a roof mount that extends more than six inches above the roof, does not follow the roof’s slope, or uses off-tone hardware. Where the governing documents already restrict solar, a homeowner may petition the membership with signatures equal to the lesser of the amendment threshold or 65% of members, and the board may not deny it if the requirements are met. The protection binds associations established after June 30, 2009 with mandatory dues, or older ones that elected in — so check whether your association is covered, get architectural-review approval in writing before you order panels, and know that a condo’s common-area roof is one of the reasons an association may say no.
Why is solar payback about 20 years in Indiana, when it is about 5 years in Illinois?
Two forces pull against each other, and in Indiana the paperwork loses. The price is a little lower than Illinois’ at $2.97 a watt against $3.05, and the sun is a little better at about 1,365 kilowatt-hours a year per installed kilowatt against about 1,290 — but the surplus is settled at about five cents instead of banking at retail, so the bright summer months earn about five cents while the dark winter months bill in full. What saves the case in Illinois is the Shines payment: about $18,040 in ComEd territory plus a $2,769 utility rebate, which together remove about three-quarters of the sticker price. Indiana has no equivalent — no REC payment, no rebate, no tax credit, no property-tax deduction — so the $24,770 sticker is the price, and about $1,167 a year of bill value at 50% self-use pays it back in about 21.2 years. In CenterPoint territory, with the highest all-in rate and the highest export credit, the same arithmetic takes about 17.3 years.