


Table of Contents
Massachusetts is the state that breaks every lazy assumption about solar. It is not particularly sunny. Its winters are long, gray, and snowy. And yet it is one of the best states in the country to put panels on a roof — because the number that matters most is not how much sun hits the roof, it is how much the electricity coming out of the wall costs. At roughly 30 cents per kilowatt-hour, Massachusetts power costs about 70% more than the national average, and every kilowatt-hour a rooftop system generates is a kilowatt-hour a homeowner never has to buy at that price. A system in Phoenix makes more electricity; a system in Boston saves more money.
That is the frame for every number in this guide. Prices are 2026 Massachusetts prices, from EnergySage quote data and installer-published indexes, not national averages with a Massachusetts label pasted on. Incentives are the ones that actually exist in 2026 — the state income tax credit, the two tax exemptions, SMART 3.0, net metering, and the battery programs — and the federal credit is shown as what it is now: zero for buyers, alive only inside a lease. Where the sources disagree, this guide says so instead of picking the friendlier number.
For the country-wide baseline, begin with our solar panel cost guide.
How Much Do Solar Panels Cost in Massachusetts in 2026?
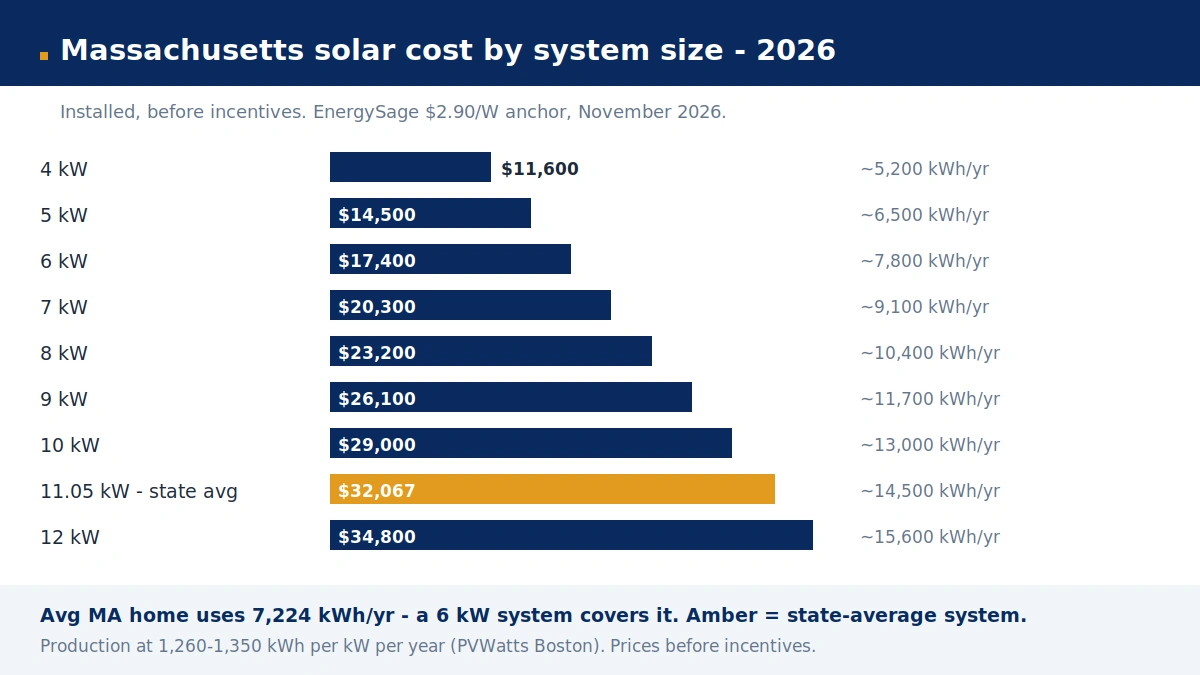
The strongest Massachusetts anchor is EnergySage’s November 2026 state page, built from real quotes in its marketplace: the average solar panel system costs $2.90 per watt including installation in Massachusetts, and for the 11.05 kW average system size in the state that comes to about $32,067 before any incentives, with prices typically ranging from $27,257 to $36,877. EnergySage’s own payback estimate for that average system is 7.01 years, with $164,927 in expected savings over 25 years after accounting for the upfront cost.
A second, independent anchor lands in the same territory. EcoGen’s September 2026 Solar Cost Index puts Massachusetts at $3.02 per watt, with a typical system of 8.74 kW costing about $26,395 in cash and a simple payback of about 7.5 years statewide. The two sources disagree slightly on the average system size — EnergySage’s 11.05 kW reflects the larger systems Massachusetts homeowners actually buy, while EcoGen’s 8.74 kW is closer to what a household needs to cover its own usage — but they agree on the price per watt within about 4%, which is a tight consensus for this market.
That $2.90 per watt sits above the national range. Our national guide puts residential solar at $2.25–$3.30 per watt in 2026, and Massachusetts lands in the upper half of that band. The premium is not mysterious: Massachusetts labor costs more, permitting and interconnection take longer, older housing stock means more electrical work, and snow-load and wind detailing add hardware that a Florida or Arizona install never needs. What the premium buys is access to the country’s most expensive residential electricity, which is what makes the payback work anyway.
The per-watt figure covers the whole installed system: panels, inverter or microinverters, racking, wiring, labor, permitting, inspection, and interconnection fees. It does not cover a new roof, a panel upgrade, tree removal, or a battery — those are separate line items, and this guide prices them where they belong instead of folding them into the headline. It also does not include incentives, because Massachusetts incentives arrive as a stack of small pieces over years, not as a single discount at signing.
One warning before the tables: quotes for the same house in Massachusetts routinely vary by 20–40%. Installer overhead and margin make up a large share of the total, and some installers quote a financed price padded with dealer fees that quietly add 15–30% over the cash price. The only number that can be compared across bidders is the cash price per watt for the same equipment on the same roof — get it in writing from at least three installers, and treat any quote that will not show it as a quote to decline.
| Source | $/W | Typical system | Total before incentives | Payback |
|---|---|---|---|---|
| EnergySage (Nov 2026) | $2.90 | 11.05 kW | ~$32,067 ($27,257–$36,877) | 7.01 yrs |
| EcoGen Index (Sep 2026) | $3.02 | 8.74 kW | ~$26,395 | ~7.5 yrs |
| EnergySage Boston | $3.03 | 8.62 kW | ~$26,138 | 6.51 yrs |
| National range (art. 4) | $2.25–$3.30 | 8.2 kW | ~$24,600 at $3.00/W | 6–12 yrs |
Solar Panel Cost in Massachusetts by System Size
System size is the first decision, and in Massachusetts it is a decision with a ceiling as well as a floor. The average Massachusetts home uses about 602 kWh a month, or 7,224 kWh a year — and a system only needs to cover that usage, plus a little headroom for an electric vehicle or a heat pump if one is coming. Oversizing past what the house uses earns net metering credits for the excess, but those credits are worth less than the retail value of power the house consumes directly, and the property-tax exemption only covers systems sized to 125% of the property’s annual needs. The table below prices every common size at the EnergySage $2.90-per-watt anchor, with expected annual production at roughly 1,260–1,350 kWh per installed kW — the PVWatts range for Boston.
| System size | Cost at $2.90/W | Approx. annual production | Share of avg. MA home use (7,224 kWh/yr) |
|---|---|---|---|
| 4 kW | $11,600 | ~5,200–5,400 kWh | ~75% |
| 5 kW | $14,500 | ~6,500–6,750 kWh | ~90% |
| 6 kW | $17,400 | ~7,800–8,100 kWh | ~110% |
| 7 kW | $20,300 | ~9,100–9,450 kWh | ~125% |
| 8 kW | $23,200 | ~10,400–10,800 kWh | ~145% |
| 9 kW | $26,100 | ~11,700–12,150 kWh | ~160% |
| 10 kW | $29,000 | ~13,000–13,500 kWh | ~180% |
| 11.05 kW (state avg) | ~$32,067 | ~14,500–14,900 kWh | ~200% |
| 12 kW | $34,800 | ~15,600–16,200 kWh | ~220% |
Two patterns in that table deserve attention. First, the price per watt falls as the system grows, because fixed costs — permitting, interconnection, the inverter, the crew’s travel and setup — spread across more watts. A 4 kW system at a small installer can easily price above $3.10 per watt, while a 12 kW system from the same installer can come in under $2.80. Second, the state-average 11.05 kW system produces roughly double what the average home uses, which tells you something important about who is buying the average system: households with electric heat, heat pumps, EVs, or plans for both. A home with gas heat and no EV usually needs 6–8 kW, not 11.
Sizing starts with the last 12 months of electric bills, not with the roof. Add up the kilowatt-hours, divide by roughly 1,300 to get the system size in kW that covers it, then adjust: add 1–2 kW for a planned EV, add more for a heat pump, subtract for a shaded or north-facing roof that will never produce at nameplate. If the roof can only fit 5 kW but the house uses 9,000 kWh a year, the honest answer is a 5 kW system that covers part of the bill — not a ground mount the budget never contemplated. Our 6 kW vs 8 kW vs 10 kW guide walks through the same sizing logic nationally.
Solar Panel Cost by City: Boston, Cambridge, Worcester & the Cape
Massachusetts is small enough to drive across in three hours and varied enough that solar prices move measurably from one metro to the next. Boston is the most expensive major market in the state; Worcester County and the outer suburbs run cheaper; the Cape and Islands sit in between, with logistics adding cost that the sunshine does not quite repay. EnergySage’s November 2026 city pages give the clearest picture.
| City / area | $/W | Avg. system | Total before incentives | Payback |
|---|---|---|---|---|
| Boston | $3.03 | 8.62 kW | ~$26,138 | 6.51 yrs |
| Cambridge | $2.95 | 9.38 kW | ~$27,711 | 6.55 yrs |
| Salem | $2.99 | 9.19 kW | ~$27,513 | 6.25 yrs |
| Waltham | $2.98 | 9.13 kW | ~$27,204 | 6.67 yrs |
| Swampscott | $2.92 | 10.15 kW | ~$29,667 | 6.39 yrs |
| East Sandwich (Cape Cod) | $2.97 | 10.07 kW | ~$29,913 | 7.06 yrs |
| Uxbridge (Worcester County) | $2.83 | 13.12 kW | ~$37,085 | 6.44 yrs |
Boston’s $3.03 per watt is the highest in the table, and the reason is not the sun — it is the city. Dense neighborhoods mean smaller roofs, tighter access, stricter permitting, and higher labor rates, and the average Boston system is smaller (8.62 kW) because the roofs are. But Boston also has the shortest payback in the metro set at 6.51 years, because Eversource’s eastern Massachusetts rates are among the highest in the state and the savings per kilowatt-hour are correspondingly larger. High price and fast payback can coexist when the electricity is expensive enough.
Uxbridge tells the opposite story: the lowest price per watt in the table ($2.83) and the largest average system (13.12 kW), because Worcester County homes tend to have bigger roofs and more land, and installers there compete harder on price. The total is the highest in the table — $37,085 — because the system is so much bigger, not because the watts cost more. That is the trap in comparing totals across cities: a $37,000 quote in Uxbridge and a $26,000 quote in Boston can both be fairly priced for completely different houses.
The utility territory matters as much as the city. Eversource serves eastern and central Massachusetts including Greater Boston, the South Shore, the North Shore, and Cape Cod (where Cape Light Compact handles the supply program but Eversource delivers the power). National Grid serves much of central and western Massachusetts. Unitil serves a smaller patch in the north-central part of the state. And about 40 municipal light plants — Holyoke, Chicopee, Braintree, and others — serve their own towns with their own rules, their own rates, and in some cases no net metering and no SMART payments at all. A quote that assumes Eversource rules is useless in a Holyoke home, and a good installer will ask which utility serves the address before quoting a payback number.
What Moves Your Quote: Roof, Panels, Inverter & Electrical
The per-watt anchor is a starting point, not a quote. Six things move a Massachusetts quote by thousands of dollars, and four of them have nothing to do with the panels.
The roof itself. Massachusetts housing stock skews old — Colonials, Capes, and triple-deckers with roofs that are often 15–25 years old. A roof with less than 10 years of life left should be replaced before panels go on, because removing and reinstalling panels around a reroof costs thousands on its own. Our roof replacement guide prices that job, and our detach-and-reset guide prices the removal separately. Steep pitches, multiple roof planes, slate or cedar, and structural reinforcement all add labor. A simple south-facing gable is the cheapest roof in the state to solarize; a cut-up Victorian with dormers on three faces is the most expensive.
Panel tier. Premium panels (high-efficiency, 25-year product warranties, better low-light performance) cost 10–20% more per watt than value-tier panels. In Massachusetts, where roof space is often the binding constraint, efficiency matters more than in states with big empty roofs: a 400-watt premium panel and a 370-watt value panel produce different amounts of power from the same square footage. But the premium only pays if the roof is space-limited. On a big unshaded roof, value panels at a lower per-watt price usually win.
Inverter choice. A string inverter is cheaper upfront; microinverters or optimizers cost more but produce more on roofs with partial shade — and Massachusetts roofs, with their maples, oaks, and dormers, are shaded more often than installers admit. Microinverters also make monitoring panel-by-panel, which matters when one shaded panel would otherwise drag down a whole string. Our inverter replacement guide covers the long-run costs of each type, including the string inverter replacement at year 10–15 that microinverter systems mostly avoid.
The electrical panel. Many Massachusetts homes still run on 100-amp service, and a solar install often forces the question. A panel upgrade to 200 amps runs $1,500–$4,000 nationally per our electrical panel upgrade guide, and it is the most common surprise add-on in Massachusetts quotes. Ask whether the quote includes it before signing, not after the electrician is on site.
Shade and trees. A mature oak over the south roof can cut production by a quarter or more. Trimming is cheap; removal is not, and in some towns it needs a permit of its own. Any installer who sizes a system without a shade analysis — a drone flight, a SunEye reading, or at minimum a site visit at midday — is guessing.
Ground mount vs rooftop. A ground-mounted array costs more to install (trenching, foundations, racking) but can be pointed due south at the perfect tilt on an unshaded patch of yard. For most Massachusetts homeowners the roof wins on cost; ground mounts make sense mainly on properties with big lots and bad roofs.
Massachusetts Electricity Rates: Why the Math Works
Everything about Massachusetts solar comes back to one number: what the power costs. The U.S. Energy Information Administration puts the Massachusetts residential average at 30.4–30.5 cents per kilowatt-hour over the 12 months to August 2026, against a national average of 18.0 cents — roughly 70% higher. The average Massachusetts bill runs about $183 a month. That gap is the whole business case: every kilowatt-hour a rooftop system generates is a kilowatt-hour the homeowner never buys at 30 cents.
The bill has two halves, and confusing them is the most common rate mistake in Massachusetts. The Basic Service supply rate — the price of the electricity itself — resets every six months (February 1 and August 1) and for the August 2026 to January 2027 term sits at 17.323 cents per kWh for Eversource eastern Massachusetts, 15.934 cents for Eversource western Massachusetts, and 17.185 cents for National Grid (fixed). Those are supply-only numbers. Delivery charges, transmission, distribution, and riders push the all-in rate up near 30 cents. A quote that values solar savings at the Basic Service rate understates the savings by nearly half; a quote that values them at the all-in rate is the honest one — and the all-in rate is what net metering credits are calculated from, as the next section explains.
Rates have also been climbing. The Massachusetts all-in average rose from 22.9 cents in 2021 to 29.6 cents in 2023, then eased slightly to 29.3 cents in 2024. That trajectory matters for payback math: a system sized at today’s rates gets more valuable every time rates rise, because the savings grow while the system cost stays fixed. Most payback models assume 2–3% annual rate escalation, which is conservative against the 2021–2023 experience. If rates stay flat, payback stretches by a year or so; if they resume climbing, it shortens.
The utility split also matters. National Grid customers paid some of the highest utility-specific rates in the state in the most recent EIA utility data (36.7 cents per kWh in 2023, against 29.7 cents for Eversource the same year) — a single-year figure, but consistent with the pattern that National Grid territory tends to be the more expensive place to buy power and therefore the faster place to pay back solar. Unitil, the smallest of the three investor-owned utilities, has the highest rates of all by some measures. And municipal light plant customers often pay considerably less than 30 cents, which is one reason solar pencils out more slowly in Holyoke or Braintree than in Boston — the power being displaced is simply cheaper there.
One more rate fact that shapes the decision: Massachusetts does not have residential time-of-use rates as the default. A kilowatt-hour saved at noon is worth the same as a kilowatt-hour saved at 7 p.m. That simplifies the math and removes one of the arguments for a battery that carries weight in California or Arizona — in Massachusetts, a battery earns its keep through backup power and the ConnectedSolutions payments, not through rate arbitrage.
Net Metering & SMART 3.0: The Two Income Streams
Massachusetts pays solar owners twice for the same kilowatt-hour, through two programs that do different jobs. Understanding which one does what is the difference between a payback estimate you can trust and one that double-counts.
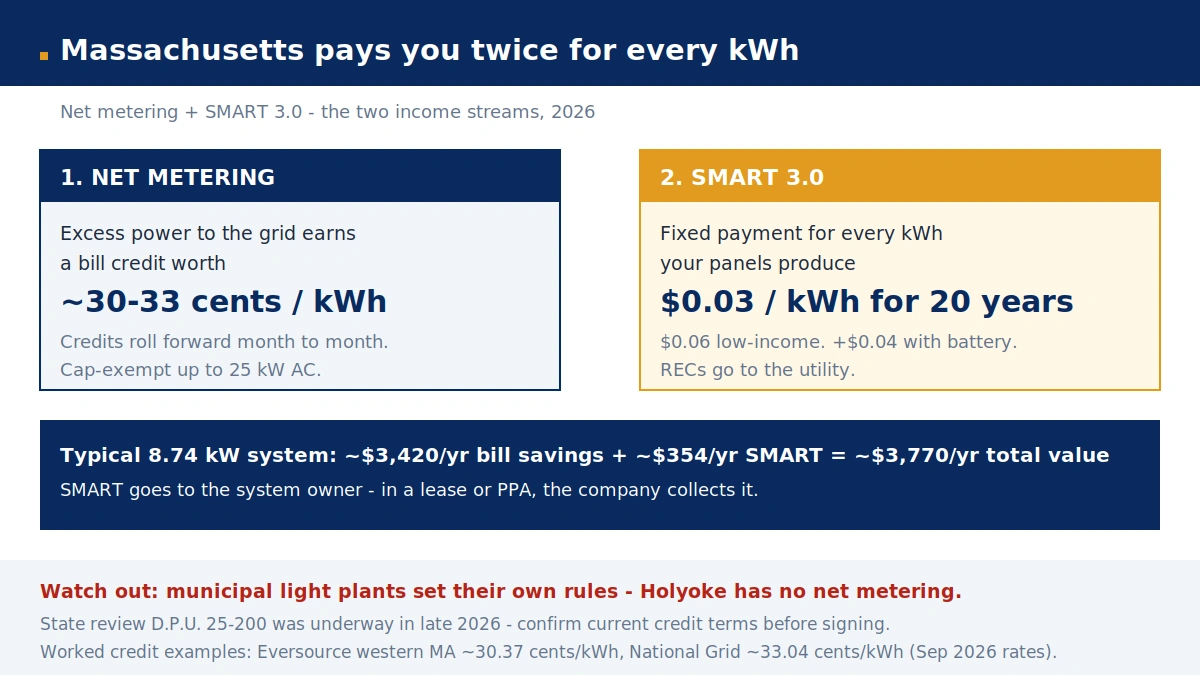
Net metering is the engine. When panels produce more than the house is using, the excess flows back to the grid and the utility issues a credit on the bill. When the sun is down, the house draws from the grid and the credits pay for it. For residential systems with an inverter rating up to 25 kW AC, Massachusetts net metering is cap-exempt — after the Department of Public Utilities raised the threshold from 10 kW to 25 kW, a normal home system can never be shut out for lack of room under the program caps. Credits roll forward month to month, so summer surplus pays for winter shortfall.
The credit is close to the full retail rate, but not exactly it. The formula is: net excess kilowatt-hours multiplied by (Basic Service + distribution + transmission + transition). The fixed customer charge and several surcharges are excluded, so a solar home’s bill never quite reaches zero — there is always a small monthly charge left. Worked examples from September 2026 rates put the credit at about 30.37 cents per kWh for an Eversource western Massachusetts residential customer and about 33.04 cents per kWh for a National Grid customer on fixed Basic Service. Those are dated examples, not promises: Basic Service resets twice a year, and the distribution and transmission components move with rate cases. But the structure is what matters — the credit tracks the retail rate, so as rates rise, the value of exported power rises with them.
Two cautions belong here. First, net metering rules do not cover municipal light plants. Each town utility sets its own export credit, and some — Holyoke Gas & Electric is the commonly cited example — do not offer net metering at all. A homeowner in a municipal-light town needs the town’s own export policy in writing before sizing a system. Second, the state is actively reviewing the program: docket D.P.U. 25-200 set a meeting on net metering for October 15, 2026, and no filing had appeared after September 30 when installers last checked. Nothing has changed yet, and this guide assumes current rules — but a homeowner signing in late 2026 should ask the installer whether anything from that docket has landed, because the credit formula is the single largest driver of payback.
SMART 3.0 is the bonus. The Solar Massachusetts Renewable Target program pays the system owner a fixed rate for every kilowatt-hour the panels produce — whether the house uses that power or exports it. Under SMART 3.0, launched in 2025, a standard residential system earns a flat $0.03 per kWh for 20 years. Income-qualified households earn $0.06 per kWh. Pairing a qualifying battery adds $0.04 per kWh, for a total of $0.07. The Department of Public Utilities approved the utilities’ payment rules on July 8, 2026, and 2027 rates were not yet set when this guide was researched — the rate is reviewed annually, so a system approved in 2026 locks in its rate for the 20-year term.
For a typical system producing about 11,800 kWh a year, SMART 3.0 is worth roughly $354 a year — real money, but not the main event. Net metering and avoided purchases do most of the work; SMART is the steady top-up that shortens payback by roughly a year. Two details matter: SMART goes to whoever owns the system, so in a lease or PPA the company collects it, not the homeowner; and in exchange for the payments, the renewable energy certificates (RECs) generated by the system go to the interconnecting utility. A homeowner who wants to keep and sell their own RECs can stay outside SMART, but for a residential system the fixed SMART payment is usually worth more than the RECs would fetch on the open market.
Together, the two streams explain why Massachusetts payback is measured in single-digit years. Net metering makes the power valuable; SMART makes the production itself valuable; and the 30-cent electricity rate makes both of them large.
Every Massachusetts Incentive Left in 2026
There is no single big Massachusetts rebate to replace the federal credit. What exists instead is a stack of smaller pieces, each modest on its own, that add up to several thousand dollars over the life of a system. Here is the complete stack, with the federal pieces kept in the next section where they belong.
| Incentive | Value | Who pays / how | Notes |
|---|---|---|---|
| Net metering credits | ~30–33 cents per exported kWh | Utility bill credit, monthly | Cap-exempt up to 25 kW AC; munis excluded |
| SMART 3.0 | $0.03/kWh for 20 yrs ($0.06 low-income; +$0.04 with battery) | Monthly utility payment | RECs go to utility; owner only |
| MA state income tax credit (Schedule EC) | 15% of net cost, up to $1,000 | State income tax | Non-refundable; unused amount carries forward up to 3 yrs |
| Sales tax exemption | 6.25% of equipment cost | No sales tax at purchase | Form ST-12; principal residence |
| Property tax exemption | Added home value untaxed for 20 yrs | Local assessor | M.G.L. c. 59, § 5, cl. 45; ≤25 kW or ≤125% of annual needs |
| ConnectedSolutions (battery) | ~$275/kW/yr summer | Annual utility payment | Eversource / National Grid / Cape Light Compact |
| Battery Program (one-time) | $100–$150/kWh | One-time rebate | 7.5–20 kWh batteries, after Connected Homes enrollment |
| Mass Save HEAT Loan | 0% APR up to $25,000 | Participating lender | Income-tiered terms; confirm solar/battery eligibility |
The state income tax credit is the most misunderstood item on the list. It is 15% of the net cost of the system, capped at $1,000 — so on a $26,000 system, 15% would be $3,900, but the credit stops at $1,000. It is non-refundable, which means it only offsets state income tax actually owed, though unused amounts can be carried forward for up to three years. It applies to systems the homeowner owns on their principal residence. A leased system does not earn it — the leasing company owns the system.
The two tax exemptions are quieter but worth real money. The sales tax exemption removes the 6.25% state sales tax from qualifying solar equipment — about $1,600 on a $26,000 system — certified with Form ST-12. The property tax exemption keeps the added value of the system off the local property tax assessment for 20 years, under M.G.L. c. 59, § 5, clause 45, for systems of 25 kW or less or producing no more than 125% of the property’s annual electricity needs. Solar consistently adds home value in resale studies, and in most states that added value would raise the tax bill; in Massachusetts it does not, for two decades.
There is no upfront state rebate for residential solar in Massachusetts, and any installer who promises one is either confused or selling something else. The state helps through the tax credit, the exemptions, and the annual payments — not through a check at signing. That is also why the payback math in this guide uses the full system cost minus only the $1,000 state credit: the other incentives arrive over years, and counting them all upfront would overstate the first-year return.
The Mass Save HEAT Loan deserves a careful note. It offers 0% APR financing up to $25,000 with income-tiered terms — seven years for households under 135% of state median income, five years for 135–300% — and it is the cheapest money available for home energy work in Massachusetts. Whether a given solar or battery project qualifies depends on the measure and the lender, so confirm eligibility with a participating lender before building a budget around it. The same program’s 0% battery financing for ConnectedSolutions participants is better documented, and the battery section below covers it.
The 2026 Federal Picture: $0 for Owners, the Lease Exception, and HEAR
This section is short because the federal picture in 2026 is simple — and because most solar marketing still describes the old law.
Homeowner-owned systems installed in 2026 get $0 in federal tax credit. The Residential Clean Energy Credit (§25D, 30%) was terminated by the One Big Beautiful Bill Act (P.L. 119-21, signed July 4, 2025) for systems placed in service after December 31, 2025, and the IRS confirmed in FS-2025-05 that the expenditure counts when installation is completed — paying in 2025 does not help if the system was finished in January 2026. The companion §25C credit for efficient home improvements ended on the same date. If a 2026 quote subtracts a 30% federal credit from a cash or loan purchase, the quote is using dead law. Ask the installer to remove it and re-price.
The one exception is third-party ownership. The commercial clean-electricity credit (§48E, 30%) survives for systems owned by a company rather than the homeowner. In a lease or power purchase agreement (PPA), the company owns the panels, claims §48E, and passes part of the value to the homeowner as a lower monthly payment. The homeowner gets no tax credit personally — but the economics of the lease can beat buying outright in 2026 precisely because the company still gets a credit the homeowner cannot. Projects must be placed in service by December 31, 2027 to qualify. The trade-off is ownership: the leasing company also collects the SMART payments, and a leased system adds little or nothing to resale value, where an owned system consistently does. Our federal tax credits guide lays out the full 2026 picture, and our national solar cost guide explains the lease-versus-buy math in detail.
HEAR does not pay for solar. The Home Electrification and Appliance Rebates program offers up to $8,000 to income-qualified households, and it still exists in 2026 — but it is an electrification program, not a solar program. HEAR covers heat pumps, heat pump water heaters, panels, and insulation-related electrical work. It does not cover solar panels, batteries, EV chargers, or windows, and since the Department of Energy’s Notice 26-2 (September 1, 2026) it is electric-to-electric only, with no fuel-switching. Any installer who folds a HEAR rebate into a solar quote is misrepresenting the program. HEAR can still matter to a Massachusetts homeowner — a heat pump paired with new solar panels is a common combination, and the heat pump half may qualify — but the solar half never does.
The honest summary: in 2026, the federal government contributes nothing to a Massachusetts homeowner who buys solar panels, and contributes indirectly — through the leasing company’s credit — to a homeowner who leases them. The state programs in the previous section are doing all the incentive work now, and they are the reason the payback still lands near seven years without Washington’s help.
Payback in Massachusetts: The Real Math by Utility
Payback is where Massachusetts solar either earns its keep or does not, and the answer depends on which utility sends the bill. The worked example below uses the EcoGen anchors so every input can be checked; the cross-checks come from EnergySage.
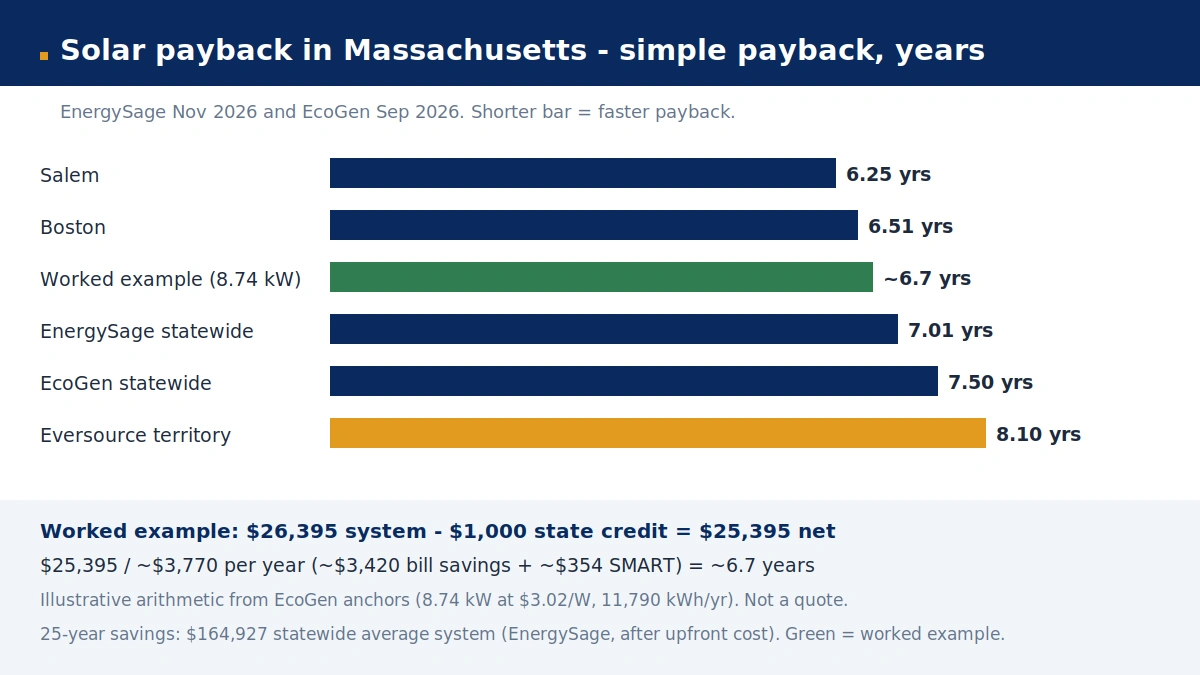
The worked example. A typical 8.74 kW system at $3.02 per watt costs $26,395 before incentives. Subtract the $1,000 Massachusetts state income tax credit and the net cost is $25,395. That system produces about 11,790 kWh a year (8.74 kW × 1,349 kWh per kW, PVWatts for Boston). Valued at roughly 29 cents per kWh in avoided purchases and net metering credits, that production is worth about $3,420 a year. SMART 3.0 adds about $354 a year (11,790 kWh × $0.03). Total first-year value: roughly $3,770. Simple payback: $25,395 ÷ $3,770 ≈ 6.7 years. That is arithmetic, not a promise — it assumes the system produces as modeled, rates stay near current levels, and the household uses or exports all of the production — but it shows why the published estimates cluster where they do.
The published cross-checks. EnergySage puts statewide payback at 7.01 years for its larger average system, with $164,927 in 25-year savings after the upfront cost. EcoGen puts it at about 7.5 years statewide, with a range of 5.8–8.1 years by utility — and names Eversource, the state’s largest utility, as the slowest at 8.1 years. Boston, on EnergySage’s city data, pays back in 6.51 years; Salem in 6.25; Cambridge in 6.55. The spread between the fastest and slowest utility territory is more than two years, which is why a statewide payback number is only a starting point and the utility-specific number is the one to budget around.
| Scenario | Simple payback | Source |
|---|---|---|
| EnergySage statewide avg (11.05 kW) | 7.01 yrs | EnergySage, Nov 2026 |
| EcoGen statewide (8.74 kW) | ~7.5 yrs | EcoGen Index, Sep 2026 |
| Eversource territory | 8.1 yrs | EcoGen |
| Boston (Eversource east) | 6.51 yrs | EnergySage Boston |
| Salem | 6.25 yrs | EnergySage Salem |
| Worked example above (8.74 kW) | ~6.7 yrs | NestPriced arithmetic from EcoGen anchors |
Why would Eversource territory be the slowest when Eversource’s eastern rates are among the highest? Because payback blends the system price, the utility’s rate, the net metering credit value, and the size of the system being modeled — and EcoGen’s utility figures reflect the full local picture, including higher installed costs in Eversource’s dense eastern territory. The Boston city figure, which is also Eversource territory, comes in faster because it models a smaller, cheaper system. The lesson is not that one source is wrong; it is that payback is sensitive to the inputs, and any installer who quotes a single payback number without showing the inputs is asking for trust instead of earning it.
What changes the payback most. Rate escalation is the biggest lever: at 3% annual increases, the 25-year savings grow by tens of thousands of dollars over a flat-rate model, and payback shortens by roughly a year. System size is the second: oversizing past household usage pushes the marginal kilowatt-hours into exported credits that are worth slightly less than consumed power, stretching payback. Shade is the third: a system that produces 20% less than modeled pays back 20% slower. And financing is the fourth: a solar loan with dealer fees can add 15–30% to the effective price, which is why the cash price per watt — not the monthly payment — is the number to compare.
The lease comparison. A lease or PPA has no payback period in the usual sense, because there is no upfront cost to recover. The homeowner starts saving (or not) from the first bill: the PPA rate per kWh is set below the utility rate, and the gap is the saving. In 2026, with §48E still available to the leasing company, PPA rates in Massachusetts are often genuinely below utility rates from day one. The catch is the long term: the homeowner never owns the system, never collects SMART, never gets the state tax credit, and the escalator clause in many PPA contracts — typically 2–3% a year — can erase the gap over a 20–25 year term if utility rates rise more slowly than the escalator. Buying wins over 25 years in most Massachusetts modeling; leasing wins for homeowners who cannot use the state credit, cannot pay upfront, or plan to move within a few years.
Winter, Snow & Cold: What Massachusetts Production Really Looks Like
The question every Massachusetts homeowner asks first — do panels even work here in winter? — has a two-part answer: yes, and less than in summer, by a predictable amount. The short days are the real constraint, not the cold or the snow.
The sun. Boston averages about 4.0 peak sun hours a day over the year, and the statewide PVWatts average runs closer to 4.7. That is less than Phoenix and more than Seattle, and it is enough: a kilowatt of panels in Boston produces roughly 1,260–1,350 kWh a year. The seasonal swing is large. A 10 kW Boston system produces about 1,750 kWh in June and about 670 kWh in December — 38% of the summer figure. June delivers roughly 5.5 peak sun hours a day; December delivers about 2.1. The December solstice brings just 9 hours and 5 minutes of daylight against 15 hours and 17 minutes in June, and at Boston’s latitude the noon sun sits only 24.5 degrees above the horizon on December 21, against 71.5 degrees on June 21. Low sun means long shadows from the neighbor’s maple and the chimney the installer swore would not matter.
The cold helps. Solar panels are more efficient when they are cold — 7–12% more efficient than the same panels running hot in summer, according to the National Renewable Energy Laboratory — and that efficiency gain partially offsets the shorter days. A crisp, clear February day in Massachusetts can produce a surprisingly strong output per hour of sunlight, because the panels are running cool while the sun is shining directly on them. The cold is not the enemy of Massachusetts solar; the darkness is.
The snow costs less than people fear. NREL data puts snow losses at 1–5% of annual production. Snow typically slides off a tilted array within 1–3 days, helped by the dark panel surface warming in the sun and by the smooth glass. A fully snow-covered day on a 10 kW Boston system loses about 22 kWh — worth roughly $6.38 at 29 cents per kWh. A week of snow cover after a nor’easter costs real money, but a season of it costs a few percent of the year’s production, not a quarter of it. Steeper tilt sheds snow faster, which is one reason Massachusetts installers often favor a steeper pitch than the textbook optimum for annual production: the textbook ignores snow, and Massachusetts does not get to.
What to actually do about winter. Nothing exotic. Do not climb on an icy roof to clear panels — the fall risk dwarfs the value of the lost production, and a scratched panel loses more than a snowy one. A roof rake with a soft head can clear the bottom rows from the ground if the array is reachable, but most owners simply wait for the melt. The design decisions that matter are made at install time: south-facing orientation where the roof allows, a tilt steep enough to shed snow, microinverters or optimizers so that a snow-covered string does not drag down the whole array, and a production estimate built on PVWatts monthly data rather than an annual average that hides the December dip. Net metering is what makes the winter work financially: summer surplus, banked as credits, pays for the winter shortfall, so the system is judged on the year, not on the darkest month.
Should You Add a Battery? ConnectedSolutions Explained
A battery is the most consequential add-on in a Massachusetts solar project — it can add $12,000 or more to the job, and whether it earns that money back depends on two programs that have nothing to do with how much sun the roof gets.
What a battery costs. A 13.5 kWh Tesla Powerwall 3, the most common home battery in the state, runs about $12,500 installed in a documented Worcester case study, and the national range for that size is roughly $12,000–$19,000. There is no federal credit for a homeowner-owned battery installed in 2026 — §25D covered storage too, and it ended on the same date. Our solar battery cost guide prices the main models nationally.
ConnectedSolutions is the reason batteries pencil out in Massachusetts. Run by Mass Save through Eversource, National Grid, and Cape Light Compact, the program pays battery owners an annual fee for letting the utility draw on stored energy during summer peak events. The headline rate is $275 per kW of average contribution during summer events — a battery delivering 5 kW on average earns about $1,375 a year — with a winter payment of about $50 per kW on top in some utility territories. National Grid reports its customers averaging about $1,200 a year. Events run June 1 to September 30, between 3 p.m. and 8 p.m., with no more than 60 events a summer and none longer than 3 hours. Enrollment locks the rate for five years, and participants also qualify for 0% battery financing. The same battery also earns the SMART adder of $0.04 per kWh on solar production, and a separate one-time Battery Program rebate of $100–$150 per kWh applies to batteries between 7.5 and 20 kWh once the system is enrolled in Connected Homes.
The backup case. Massachusetts loses power most often to nor’easters and ice storms, not to summer heat — and a battery keeps the heat, the fridge, and the sump pump running through an outage that can last a day or more in the western hills. That is a real value, but it is a resilience value, not a financial return, and it should be weighed as one: a battery that never earns back its cost in program payments can still be worth buying for a household with medical equipment, a well pump, or a history of multi-day outages. A generator is the cheaper backup for most homes, and the battery’s advantage is silence, automatic switchover, and no fuel — not price.
The payback verdict. Stacking ConnectedSolutions payments, the SMART battery adder, and the one-time rebate, a Massachusetts battery can pay for itself in roughly 6–8 years in the best cases — but that figure comes from installer case studies, not from a state-published average, and it depends on the battery actually delivering its rated kilowatts during events. Without ConnectedSolutions enrollment, the financial case collapses: a battery that only provides backup and shifts a little self-consumption cannot repay $12,500 at Massachusetts rates, because there is no time-of-use arbitrage to harvest. Unitil customers face this directly — Unitil does not offer ConnectedSolutions, and offers a one-time $100 per kWh battery rebate instead. For a Unitil household, the battery is a backup purchase, and it should be budgeted as one.
HOAs, Condos, Permits & Picking an Installer
Massachusetts law is firmly on the homeowner’s side on solar access — and firmly on the side of paperwork everywhere else. Both halves matter before signing.
HOAs cannot ban solar in Massachusetts. Massachusetts General Laws chapter 184, section 23C provides that any provision forbidding or unreasonably restricting the installation or use of a solar energy system is void and unenforceable, and it applies to homeowners associations, condominiums, and cooperatives alike. The state’s zoning law (chapter 40A) adds that no zoning ordinance or by-law shall prohibit or unreasonably regulate solar installations except where necessary to protect public health, safety, or welfare. Reasonable restrictions — on placement, on aesthetics, on installation standards — are allowed; a blanket ban is not, and neither is a restriction that effectively prevents solar or unreasonably cuts the system’s output.
Condos are the exception that proves the rule. In a condominium, the roof is typically common area — the unit owner does not own it — and the board can require an approval process covering plans, engineering, insurance, licensed installation, and a maintenance plan. A Massachusetts Land Court decision confirmed that section 23C applies to condominium provisions, but also that a board’s approval process, exercised with reasonable discretion, stands. The practical line: a board can make a homeowner go through a process, but it cannot use that process as a permanent “no.” The state energy office and the Clean Energy States Alliance publish a dedicated Solar Guide for Condominium Owners and Associations for exactly this situation, and a condo owner should read it before applying.
Permits and interconnection take time. A Massachusetts rooftop system needs a building permit, an electrical permit, and a utility interconnection agreement, in that order — and the interconnection step is usually the slowest, running weeks to a few months depending on the utility and whether the local transformer needs an upgrade. No statewide permit fee schedule was verified for this guide, so no fee figure is given here; the town’s building department sets it. What can be said with confidence is that the timeline, not the fee, is the bottleneck, and an installer who promises permission to operate in two weeks is promising something the utility controls, not the installer.
Installer credentials to verify. Massachusetts solar work sits at the intersection of two credentials that are not interchangeable: HIC registration, which applies broadly to contractors working on existing one-to-four-unit owner-occupied homes, and the CSL (Construction Supervisor License), a separate credential for work requiring construction supervision. Verify both, plus the electrical license, before signing — and verify that the company, not just a subcontractor, holds them.
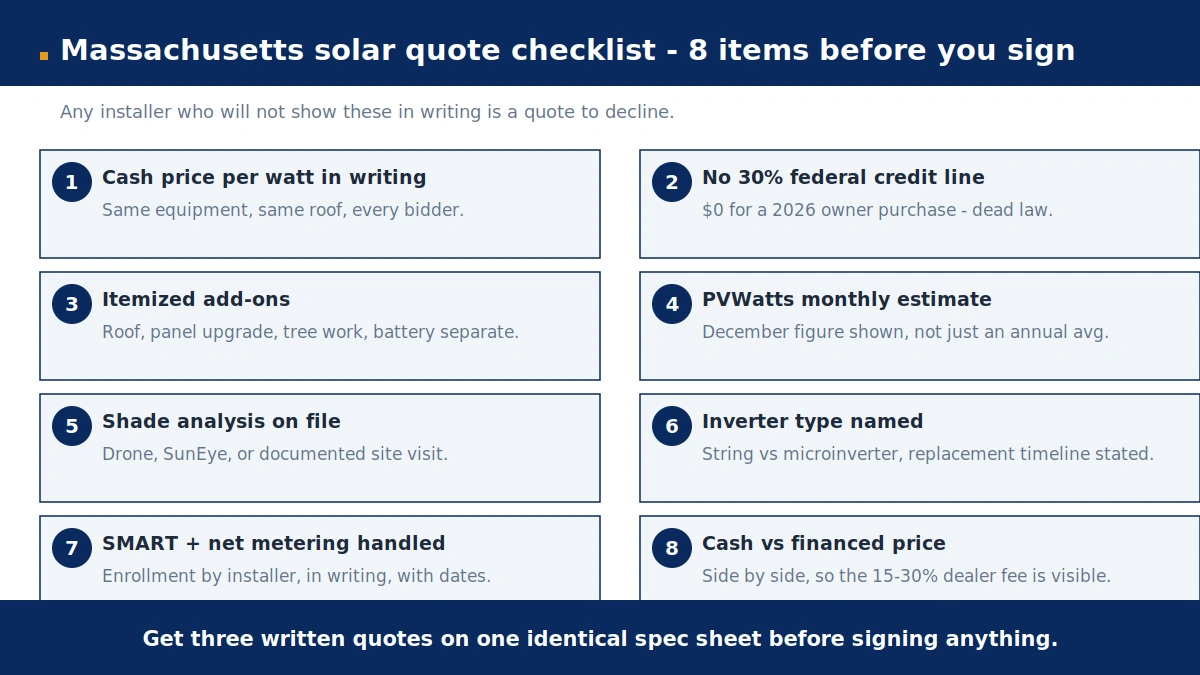
The eight-item quote checklist:
- Cash price per watt in writing — the same equipment, the same roof, from every bidder. No cash price, no comparison.
- No 30% federal credit line — $0 for a 2026 owner purchase. A quote that still subtracts it is using dead law.
- Itemized add-ons — roof work, panel upgrade, tree work, and battery shown as separate lines, not buried in the per-watt price.
- Production estimate from PVWatts monthly data — with the December figure shown, not just an annual average.
- Shade analysis on file — drone, SunEye, or a documented site visit, not a satellite guess.
- Inverter type named — string vs microinverter vs optimizer, with the replacement timeline stated.
- SMART and net metering enrollment handled by the installer — in writing, with the application dates.
- No dealer-fee surprise — if financing, the cash price and the financed price side by side, so the 15–30% dealer fee is visible.
Buy, lease, or community solar? Buying wins over 25 years for most Massachusetts homeowners who can use the state credit and plan to stay — it keeps SMART, the tax credit, the exemptions, and the resale value. Leasing or a PPA wins for homeowners who want $0 upfront and a lower bill from month one, and who accept that the company keeps the incentives and the system. Community solar wins for everyone else: renters, condo owners whose board will not approve a roof array, and homes with shaded or unsuitable roofs. It needs no roof at all — a subscription to a local solar farm earns bill credits that cut the electric bill, with no installation and no 20-year commitment. Our community solar guide prices that option, and our heat pump vs solar comparison helps households deciding which big energy purchase comes first.
Sources & methodology
Cost anchors: EnergySage — “Massachusetts Solar Panel Cost: 2026 Prices and Savings” (Nov 2026: $2.90/W, 11.05 kW avg, ~$32,067, range $27,257–$36,877, payback 7.01 yrs, 25-yr savings $164,927) and city pages Boston ($3.03/W, 8.62 kW, $26,138, 6.51 yrs), Cambridge ($2.95/W, 9.38 kW, $27,711, 6.55 yrs), Salem ($2.99/W, 9.19 kW, $27,513, 6.25 yrs), Waltham ($2.98/W, 9.13 kW, $27,204, 6.67 yrs), Swampscott ($2.92/W, 10.15 kW, $29,667, 6.39 yrs), East Sandwich ($2.97/W, 10.07 kW, $29,913, 7.06 yrs), Uxbridge ($2.83/W, 13.12 kW, $37,085, 6.44 yrs); EcoGen America — “Massachusetts Solar Panels (2026)” (Sep 2026 Cost Index: $3.02/W, 8.74 kW typical, ~$26,395, payback ~7.5 yrs statewide, 5.8–8.1 by utility, Eversource 8.1; 1,349 kWh/kW/yr PVWatts Boston; SMART ~$354/yr typical) and “Massachusetts Solar Incentives (2026)” (SMART 3.0 $0.03/kWh 20 yrs; DPU approval Jul 8, 2026; D.P.U. 25-200 meeting Oct 15, 2026; ConnectedSolutions $275/kW; Holyoke no net metering); EnergySage — “Massachusetts Solar Incentives, Tax Credits & Rebates 2026” (SMART +$0.04/kWh battery adder; Battery Program $100–$150/kWh; ConnectedSolutions ~$1,375/yr at 5 kW; 0% battery financing).
Rates: EIA via Kadoa (12 mo to Aug 2026: MA 30.4 cents/kWh, US 18.0 cents, avg bill ~$183/mo) and ElectricRates.org (MA 30.5 cents/kWh, Nov 5, 2026); Solar Examiner (Basic Service reset Aug 1, 2026: Eversource east 17.323 cents, west 15.934 cents, National Grid 16.669 cents; EIA Aug 2026 30.48 cents); SouthCoast360 (Eversource 17.323 cents, National Grid 17.185 cents fixed, Aug 1, 2026–Jan 31, 2027); Palmetto MA page (rates 22.9 cents 2021 → 29.6 cents 2023 → 29.3 cents 2024; National Grid 36.7 cents vs Eversource 29.7 cents in 2023 EIA utility data; ~159,000 MA households with solar; 4.7 peak sun hours/day).
Net metering + SMART: Northeast Solar — “Massachusetts SMART 3.0” (Sep 14, 2026: credit formula, Eversource western ~30.37 cents/kWh, National Grid ~33.04 cents/kWh, SMART $0.03/kWh 20 yrs, $0.06 low-income, RECs to utility); Mass.gov SMART 3.0 program details and net metering guide (via installer citations); LegalClarity MA tax credits page (state credit 15% up to $1,000; SMART 3.0; sales tax exemption 6.25%).
Batteries: ROI Solar — “Is Solar Worth It in Massachusetts? 2026 Guide” (ConnectedSolutions Eversource $275/kW summer + $50/kW winter, National Grid $225/kW summer; Unitil $100/kWh one-time instead; no ConnectedSolutions); Habbb — “Home Battery Payback USA 2026” (Worcester 8 kW + Powerwall 3 battery $12,500 installed; ConnectedSolutions $275/kW summer + $50/kW winter, 5-yr lock; battery payback 6–8 yrs stacked — installer case study, not a state average).
Production + winter: Joule — “Do Solar Panels Work in Winter?” (NREL PVWatts: 10 kW Boston Dec ~670 kWh vs Jun ~1,750 kWh, 38%; annual ~12,600 kWh; June 5.5 PSH vs Dec 2.1; cold efficiency +7–12%; snow losses 1–5%, slides off 1–3 days; snow day loss ~22 kWh ≈ $6.38 at 29 cents); GreenWatt peak sun hours (MA 4.7/day, July 6.46).
HOA + licensing: NuWatt — “Can Your HOA Block Solar Panels?” (M.G.L. c. 184, §23C void and unenforceable; applies to HOAs, condos, cooperatives); Landmark Associates — condo solar in MA + RI (Jan 20, 2026: §23C applies to condos; board approval with reasonable discretion stands; HIC vs CSL not interchangeable; DOER/CESA condo solar guide; HB 3685 proposed).
Federal + financing: OBBBA P.L. 119-21 / IRS FS-2025-05 (§25D and §25C $0 for post-Dec-31-2025 installs); NuWatt MA solar guide + Bright Home Solutions FAQ (§48E 30% for third-party-owned systems, placed in service by Dec 31, 2027; Mass Save HEAT Loan 0% APR up to $25,000, 7-yr under 135% SMI, 5-yr 135–300% SMI — confirm solar/battery eligibility with lender); SaveOnEnergy Boston page (MA avg use ~602 kWh/mo = 7,224 kWh/yr; property tax exemption 20 yrs; sales tax exemption).
Payback arithmetic: the worked example in the payback section is NestPriced arithmetic from EcoGen anchors (8.74 kW × $3.02/W = $26,395; minus $1,000 state credit = $25,395; 11,790 kWh/yr × ~29 cents ≈ $3,420 + SMART ~$354 ≈ $3,770/yr → ~6.7 yrs). Labeled illustrative in the draft. Production range 1,260–1,350 kWh/kW/yr blends Joule PVWatts (1,260) and EcoGen PVWatts Boston (1,349).
EXCLUDED: any “after 30% credit” prices; any HEAR-for-solar claim (HEAR does not cover solar, batteries, EV chargers, or windows; electric-to-electric only since DOE Notice 26-2, Sep 1, 2026); any MA upfront state rebate (none exists); the D.P.U. 25-200 net-metering review outcome (not published at research time); MA-specific permit fees or interconnection timelines (not verified — described qualitatively only); MA-specific panel-upgrade or roof dollar figures (national guide figures cited as such); MA-specific installer APRs (none given); the National Grid ConnectedSolutions summer rate conflict ($225 vs $275/kW — headline uses Mass Save $275/kW with the National Grid average noted).
*Disclaimer: Prices are 2026 Massachusetts planning figures and change by city, roof, utility territory, and contractor. Collect three written quotes from local installers before locking in a budget. Tax notes here are general information, not advice for your return — check with a Massachusetts tax professional before you file. Program rules (SMART rates, net metering, ConnectedSolutions) are reviewed annually — confirm current terms with Mass Save, MA DOER, and your utility before signing.*
How much do solar panels cost in Massachusetts in 2026?
The average Massachusetts system costs $2.90 per watt installed (EnergySage, November 2026) — about $32,067 for the 11.05 kW average system, with most quotes landing between $27,257 and $36,877. A typical 8 kW home system runs about $23,200 and a 10 kW system about $29,000 at that per-watt rate. Boston is the priciest major market at $3.03 per watt, while Worcester County runs cheaper at about $2.83 per watt. The 30% federal credit is $0 for homeowner-owned systems installed in 2026.
Is solar worth it in Massachusetts in 2026 without the federal tax credit?
Yes, for most homeowners with a suitable roof — because Massachusetts electricity costs about 30 cents per kWh, roughly 70% above the national average. EnergySage puts the average payback at 7.01 years with $164,927 in 25-year savings after the upfront cost, and EcoGen puts it at about 7.5 years statewide. The state still pays you twice per kilowatt-hour through net metering credits near the full retail rate and SMART 3.0 at $0.03 per kWh for 20 years, plus a state income tax credit up to $1,000 and two tax exemptions. The math is weakest in municipal-light towns with cheap power and no net metering.
How does net metering work in Massachusetts?
When your panels produce more than your home uses, the excess flows to the grid and your utility credits your bill. The credit equals your net excess kilowatt-hours multiplied by (Basic Service + distribution + transmission + transition) — about 30–33 cents per kWh in worked 2026 examples — and credits roll forward month to month, so summer surplus pays for winter use. Residential systems up to 25 kW AC are exempt from program caps. Municipal light plants set their own rules, and some offer no net metering at all. A state review (D.P.U. 25-200) was underway in late 2026, so confirm current terms before signing.
What is SMART 3.0 and how much does it pay?
SMART 3.0 is Massachusetts’ production incentive: it pays the system owner a flat $0.03 per kWh for every kilowatt-hour the panels produce, for 20 years. Low-income households earn $0.06 per kWh, and pairing a qualifying battery adds $0.04 per kWh. A typical 8.74 kW system earns roughly $354 a year. In exchange, the renewable energy certificates go to the utility. SMART goes to the system owner, so in a lease or PPA the company collects it, not the homeowner. It only applies to Eversource, National Grid, and Unitil customers.
Can my HOA or condo stop me from installing solar in Massachusetts?
An HOA cannot ban solar: Massachusetts law (M.G.L. c. 184, §23C) makes any provision forbidding or unreasonably restricting solar void and unenforceable, and the zoning law (c. 40A) bars towns from unreasonably regulating it. Reasonable restrictions on placement or aesthetics are allowed. Condos are different because the roof is usually common area — the board can require an approval process covering plans, engineering, insurance, and maintenance, but it cannot use that process as a permanent no. The state publishes a Solar Guide for Condominium Owners and Associations for exactly this situation.
Do solar panels work in Massachusetts winters and snow?
Yes. A kilowatt of panels in Boston produces roughly 1,260–1,350 kWh a year. December output is about 38% of June output (about 670 kWh vs 1,750 kWh for a 10 kW system), because the days are short and the sun is low — not because of the cold, which actually boosts panel efficiency by 7–12%. Snow costs only 1–5% of annual production; it typically slides off within 1–3 days, and a fully snow-covered day loses about 22 kWh (roughly $6.38). Net metering banks summer surplus as credits that pay for the winter shortfall.
Should I add a battery in Massachusetts?
It depends on ConnectedSolutions. A 13.5 kWh battery costs about $12,500 installed, and Mass Save’s ConnectedSolutions program pays about $275 per kW per year for letting the utility draw on it during summer peak events — roughly $1,375 a year for a 5 kW contribution — plus a SMART battery adder of $0.04 per kWh and a one-time rebate of $100–$150 per kWh. Stacked, a battery can pay back in roughly 6–8 years, but that is an installer case-study figure, not a state average. Without ConnectedSolutions enrollment there is no rate arbitrage to harvest, so the battery is a backup purchase, not an investment — and Unitil customers cannot join ConnectedSolutions at all.
Should I buy, lease, or join community solar in Massachusetts?
Buying wins over 25 years for most homeowners who can use the $1,000 state credit and plan to stay: you keep the SMART payments, the tax credit, the exemptions, and the resale value. A lease or PPA wins if you want $0 upfront and a lower bill from month one — the company claims the surviving 30% commercial credit (§48E) and passes part of it on as a lower rate, but it also keeps SMART and the system. Community solar wins if you rent, own a condo whose board will not approve a roof array, or have a shaded or unsuitable roof: you subscribe to a local solar farm, earn bill credits, and install nothing.