


Table of Contents
Oklahoma is a state where the solar numbers pull in opposite directions, and the pull is what makes the decision interesting. The sun is generous. The install price is among the lowest in the country. The roofs are big and mostly unshaded. Then the electric bill arrives, and the other half of the story shows up: power in Oklahoma costs about 14.82 cents a kilowatt-hour, the 13th-cheapest in the nation, so every kilowatt-hour a panel makes replaces a cheap one. A system here generates more electricity than the same system in Ohio and saves less money doing it.
That does not make solar a bad buy in Oklahoma. It makes the sizing and the utility rules the whole decision. Oklahoma has something its southern neighbor Alabama does not: a real net-metering framework, written into state law, that lets generation cancel consumption one-for-one at the full retail rate inside each monthly bill. Use the power while the sun is up, or bank it against the evening inside the same month, and the panels earn the full retail price. Oversize the array, or live in Edmond Electric territory where exports earn nothing at all, and the economics fall apart fast. The math below runs separately for OG&E, for PSO, and for the municipal and co-op utilities, so jump to your own provider and skip the rest.
Before you read on, start with the country-wide baseline in our solar panel cost guide.
How Much Do Solar Panels Cost in Oklahoma in 2026?
Three solid anchors describe the Oklahoma market in 2026, and they agree with each other unusually well. EnergySage’s state page for November 2026 — drawn from live marketplace quotes — lists $2.58 per watt installed as the state average. At the 14.22 kW average system size that works out to about $36,644 before incentives, with most quotes falling between $31,147 and $42,141. EnergySage’s payback estimate for that same average system is 16.15 years, alongside $27,942 of expected savings across 25 years and a 77% offset of a household’s yearly use.
The second anchor is supplied by EcoGen’s September 2026 Solar Cost Index, and it assumes a very different system size. EcoGen’s number for Oklahoma is $2.64 per watt, and its typical 7.42 kW system comes to about $19,589 in cash. That 7.42 kW figure is a measured median — Berkeley Lab’s 2025 median for Oklahoma, drawn from 121 installed systems in the state — not a model. A third snapshot lands in the same place: SolarReviews’ November 2026 cost page puts Oklahoma at $2.64 per watt as well, with a 7.0 kW average system at $19,618.
Taken together, the three anchors sit within about 2-3% of each other on price per watt — the tightest agreement anywhere in this series — and all three place Oklahoma near the cheap end of the national table. EcoGen ranks Oklahoma the 6th cheapest of all 51 jurisdictions in its index, below the national average of $2.89, and cheaper than most of its neighbors except Arkansas at $2.56 and Texas at $2.57. New Mexico runs $2.71, Missouri $2.74, and Kansas $2.87. Identical panels, an identical inverter, and an identical crew would run roughly $5,000 more on a Kansas roof than on an Oklahoma one — and hardware is not the reason. Oklahoma has a deep installer field, low electrician wages — a median of $29.33 an hour, $61,010 a year, per the Bureau of Labor Statistics for May 2025 — and plenty of volume to spread fixed costs across.
Nearly all of the gap between the two headline totals comes from system size, not from price per watt — each source simply assumes a different system. EnergySage’s 14.22 kW figure is an average of marketplace quotes, dragged upward by very large systems on very large, heavy-use homes. Oklahoma houses use about 1,079 kilowatt-hours a month, and the quote average reflects the heaviest users among them. EcoGen’s 7.42 kW is the size a typical Oklahoma home actually had put on its roof. A 14.22 kW system would make about 22,170 kilowatt-hours a year — roughly 171% of what the average Oklahoma home uses — which is why the 125% peak-load sizing cap in the state net-metering rule matters, and why exports priced near 4 cents punish oversizing.
The whole installed job sits inside that per-watt figure: panels, inverter or microinverters, racking, wiring, labor, permits, inspection, and the interconnection itself. A new roof, a panel upgrade, tree work, and a battery are all extra, and out in western Oklahoma the hail detailing a Hail Alley roof needs is usually extra too. Each extra shows up as its own line item, and this guide prices each one where it comes up. No incentives sit inside that price either, because Oklahoma has none to put there: no state credit to subtract, no rebate to wait for, and no federal credit on a 2026 owner purchase. One more thing to watch: Oklahoma charges its 4.5% state sales tax on solar equipment, plus city and county tax on top, so a quote that omits sales tax understates the cash price. Get the installer to list sales tax as a separate line on the quote.
One caution before the tables: the lowest quote in Oklahoma is not always the lowest-cost system overall. Overhead and margin make up a large slice of the installer’s total, and loan quotes routinely hide dealer fees of 10-30% of the cash price — sometimes more — inside the amount financed. When you compare bidders, just one number lines up cleanly: cash price per watt for identical equipment on the identical roof. Get that number in writing from at least three installers, and drop any bidder who will not show it.
| Source | $ per watt | System | Cash total | Payback |
|---|---|---|---|---|
| EnergySage (Nov 2026) | $2.58 | 14.22 kW | ~$36,644 ($31,147-$42,141) | 16.15 yrs |
| EcoGen Index (Sep 2026) | $2.64 | 7.42 kW | ~$19,589 | ~12 yrs (PSO) |
| SolarReviews (Nov 2026) | $2.64 | 7.0 kW | ~$19,618 | Not published |
| HomeSolarAtlas (Aug 2026) | $2.62 | 10 kW | ~$26,200 | 13.2 yrs |
| RenewEstimator (Jul 2026) | $2.60 | 8 kW | ~$20,400 | 15.2 yrs |
| National range (article 4) | $2.25-$3.30 | 8.2 kW | ~$24,600 at $3.00/W | 6-12 yrs |
Two sources in the table deserve a footnote rather than a headline. SolarReviews’ incentives page shows the same $2.62-$2.64 per watt but still subtracts a $5,502 “tax credit” from its totals — that is the dead 30% federal credit, and the after-credit column is stale and must not be used. ConsumerAffairs prices a typical Oklahoma install at $37,480 and reports a 9.8-year payback with $43,701 in 25-year savings, but that is a modeled estimate that does not appear to price the roughly 4-cent export rate, so it is an outlier against EcoGen and EnergySage and is flagged here rather than headlined. And one weak single-source site, oklahomastatesolar.org, claims $2.32 a watt plus a “100% sales tax exemption” and a solar-access law — all three claims are contradicted by stronger sources, and none of them is used anywhere in this guide.
Solar Panel Cost in Oklahoma by System Size
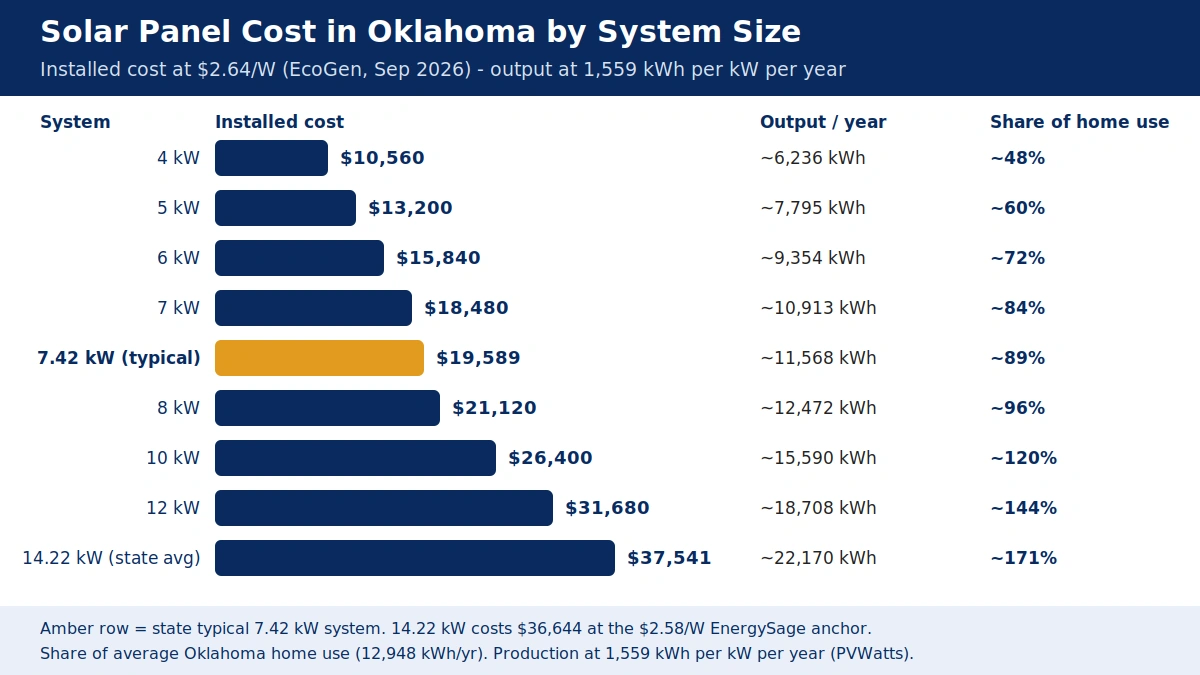
Size is the first decision, and in Oklahoma the net-metering rules reward you for getting it right. The average Oklahoma home uses about 1,079 kilowatt-hours a month, or roughly 12,948 a year — heavy by national standards, driven by long cooling seasons and summer air conditioning. One kilowatt of panels here generates about 1,559 kilowatt-hours a year, so a 7.42 kW array generates about 11,568 kilowatt-hours — roughly 89% of what the average home uses in a year. That is what makes 7.42 kW the state typical size. It covers nearly the whole house without flooding the grid with power that earns three to four cents.
Going bigger than the house uses is a worse deal in Oklahoma than in a state with annual net metering, because Oklahoma nets by the month, not by the year. Summer surplus does not bank against winter bills. In any given month, each kilowatt-hour beyond your own use goes out at the avoided-energy price — about 3-4 cents on OG&E and PSO — while each kilowatt-hour used at home saves the full retail price of around 13-15 cents. That gap is why the table below turns unattractive past 10 kW for most Oklahoma homes. Every common size in the table is priced off the EcoGen anchor of $2.64 a watt, with output at 1,559 kilowatt-hours per installed kilowatt per year. It also carries the share of average home use, so you can see at a glance where the system stops covering the house and starts exporting.
| Size | Cost at $2.64/W | Yearly output | Share of avg. OK home use (12,948 kWh/yr) |
|---|---|---|---|
| 4 kW | $10,560 | ~6,236 kWh | ~48% |
| 5 kW | $13,200 | ~7,795 kWh | ~60% |
| 6 kW | $15,840 | ~9,354 kWh | ~72% |
| 7 kW | $18,480 | ~10,913 kWh | ~84% |
| 7.42 kW (state typical) | ~$19,589 | ~11,568 kWh | ~89% |
| 8 kW | $21,120 | ~12,472 kWh | ~96% |
| 10 kW | $26,400 | ~15,590 kWh | ~120% |
| 12 kW | $31,680 | ~18,708 kWh | ~144% |
| 14.22 kW (state avg) | ~$37,541 at $2.64/W ($36,644 at $2.58/W) | ~22,170 kWh | ~171% |
Two rows in that table deserve a second look. First, the 14.22 kW state-average system generates about 171% of what the average home uses. That tells you who buys the average system: households with electric vehicles, heat pumps, pools, or all-electric everything, plus the oversizing that a quote average rarely talks anyone out of. A gas-heated home with no EV usually needs 7-8 kW, not 14. Second, the 125% peak-load rule in the state net-metering framework caps how large a system can be — the array may not be designed to produce more than 125% of the home’s expected peak load, measured from the 12 months before the application — so a system sized to 171% of annual use may not even qualify for net metering as designed. The rule is the binding constraint for most homes, and it is why the sizing conversation has to start with the bills, not the roof.
Work out the size from a full year of electric bills, not from the roof area that happens to be available. Total the kilowatt-hours, divide by roughly 1,559 to find the kilowatt size that covers them, then adjust: add 1-2 kW for a planned EV, add more for a heat pump or a pool pump, subtract for a shaded or north-facing roof — and then check the result against the 125% peak-load ceiling, which is set by the past 12 months of bills. If you plan to add an EV or a heat pump, add the load first and design the solar second, or the cap locks you into a smaller array than the bigger house will need. That sizing logic gets a full walk-through for the country at large in our 6 kW vs 8 kW vs 10 kW guide.
Solar Panel Cost by City: Oklahoma City, Tulsa, Norman & Edmond
Oklahoma is a compact state with one big solar market split across two utilities, and the price spread between its cities is narrow — the five requested cities cluster tightly at $2.52-$2.59 a watt. What differs between them is not the install price but the utility behind the meter, and in Edmond that difference is the largest in the state. EnergySage’s city pages for November 2026 show that spread most clearly.
| City | $ per watt | Avg. system | Cash total | Payback | 25-yr savings |
|---|---|---|---|---|---|
| Oklahoma City | $2.55 | 13.46 kW | ~$34,359 | 16.81 yrs | $21,071 |
| Tulsa | $2.58 | 12.56 kW | ~$32,394 ($27,535-$37,253) | 12.82 yrs | $43,003 |
| Norman | $2.59 | 12.9 kW | ~$33,470 ($28,450-$38,490) | 16.49 yrs | $20,745 |
| Edmond | $2.56 | 16.23 kW | ~$41,469 | 17.34 yrs | $23,338 |
| Lawton | $2.52 | 15.99 kW | ~$40,312 ($34,265-$46,359) | 14.34 yrs | $42,497 |
| Enid | $2.50 | 15.1 kW | ~$37,779 ($32,112-$43,446) | 16.74 yrs | $26,248 |
| Broken Arrow | $2.57 | 13.26 kW | ~$34,154 ($29,031-$39,277) | 22.22 yrs | $6,688 |
| Owasso | $2.51 | 17.55 kW | ~$44,120 ($37,502-$50,738) | 19.36 yrs | $21,412 |
| Altus | $2.60 | 13.57 kW | ~$35,242 ($29,956-$40,528) | 11.74 yrs | $48,339 |
| Choctaw | $2.52 | 16.13 kW | ~$40,658 ($34,559-$46,757) | 17.69 yrs | $21,680 |
| Sapulpa | $2.60 | 11.53 kW | ~$29,907 ($25,421-$34,393) | 16.19 yrs | $18,735 |
Oklahoma City is the biggest market in the state, served by OG&E, at $2.55 a watt — the second-cheapest of the big four — with a 13.46 kW average system at about $34,359. Tulsa, served by PSO, runs $2.58 a watt on a smaller 12.56 kW average system at about $32,394, and its published payback of 12.82 years is the shortest of the four main cities, which tracks with PSO’s higher retail rate and its published per-utility payback of about 12 years. Norman, home to the University of Oklahoma and served by Oklahoma Electric Cooperative, runs $2.59 a watt on a 12.9 kW average system at about $33,470 — and Norman is the one city in the four where the co-op mirrors the state net-metering structure, so the economics there look much like OG&E and PSO territory.
Edmond is the city to read carefully. At $2.56 a watt its install price is unremarkable, but its average system is 16.23 kW — the largest of the five requested cities — at about $41,469, and its published payback of 17.34 years is the longest of the four. Edmond is served by Edmond Electric, a municipal utility that sits outside the state net-metering rule, pays nothing at all for exported power, and charges solar homes a $30-a-month customer charge instead of the standard $14. Whether the oversized average system is a response to those terms or simply quote-sample noise is not something the data can settle, and this guide does not over-interpret it — but an Edmond homeowner who sizes to the state average and expects state-rule net metering will be disappointed twice over.
Use price per watt to rank the cities, never the payback column. Broken Arrow shows 22.22 years and $6,688 in 25-year savings while Tulsa, about 15 miles away, shows 12.82 years and $43,003 — at nearly identical prices per watt. A second, duplicate EnergySage page for Broken Arrow in Tulsa County gives 15.9 years for the same city. Those swings come from EnergySage model variance: different system sizes, different rate assumptions, and different savings models inside each city’s page. They are not a real signal that one suburb is twice as good for solar as the next. When you compare cities, price per watt is the column to use. A payback number only means something when it comes from your own utility’s tariff — and the payback section below does that work for each one.
One more city-level note: the top installers named on EnergySage’s Oklahoma pages in October 2026 are Affordable Solar, Beall Power Solutions of Edmond, Okie Solar of Oklahoma City, Palmetto Energy, and Tribe Solar & Electric. A deep installer bench is part of why Oklahoma prices stay low — get three quotes, and make at least one of them from a company that has been installing in your utility’s territory for years, because the interconnection paperwork differs by utility and an installer who knows your utility’s forms saves weeks.
Oklahoma’s Sun: Production, Heat & Hail
Oklahoma’s sunshine ranks in the national top ten, and it arrives with a climate that asks real questions of the equipment. A production estimate that is honest has to carry both halves of the story.
The sun. One kilowatt of panels in Oklahoma generates roughly 1,559 kilowatt-hours a year on EcoGen’s PVWatts-based figures, and a 7.42 kW array generates about 11,568 kilowatt-hours — about 89% of the average home’s yearly use. Cross-checks land close: GreenWatt’s PVWatts v8 modeling gives 1,542 kilowatt-hours per kilowatt a year, Palmetto gives 1,530 for a 10 kW system, and HomeSolarAtlas gives a planning yield of 1,490. Use 1,490-1,559 as the range, with EcoGen’s 1,559 as the anchor. Peak sun hours run about 5.5 a day on the annual average (GreenWatt, PVWatts v8, Oklahoma City), peaking near 7.25 hours in June, and Oklahoma ranks roughly 7th to 11th nationally for sunshine. June is the best month; December is the worst.
The seasonal shape is a gentle hill, not a cliff. Palmetto’s modeling for a 10 kW system gives about 49.7 kilowatt-hours a day in July and about 32.0 a day in December — roughly a 55% summer-to-winter swing, milder than northern states. There is no snow season to model, and no month when output falls off the way it does in the Northeast. No verified Oklahoma monthly PVWatts table was pulled for this guide, so the seasonal shape is described qualitatively here rather than as a month-by-month table — if an installer shows you one, ask to see the PVWatts run behind it.
Heat trims what the sun gives. As cell temperature rises, panel efficiency falls — by roughly 0.3-0.5% for every degree Celsius the cell runs above 25 degrees. An Oklahoma rooftop in July runs far hotter than 25 degrees, so a system here generates less per hour of sunshine than the same panels would on a cool spring day. Long days more than compensate over the year, which is why the annual figure still lands near 1,559 kilowatt-hours per kilowatt. Even so, a production estimate built on nameplate wattage without a temperature derate overstates summer output. Ask the installer to show the derate inside the production model it hands you.
Hail is the defining Oklahoma risk. Oklahoma sits in Hail Alley, the Texas-Oklahoma-Kansas-Nebraska corridor in the 2-inch hail zone, and the numbers are stark: the NOAA Storm Events Database records 30,254 hail events in Oklahoma from 1950 through September 2025. Panels rated UL 61730 / IEC 61730 are tested to withstand 1-3 inch hailstones at 16.8-88.3 mph, and the IEC 61215 baseline is 25mm (1-inch) ice balls at 23 meters a second, 11 impacts, with less than 5% power loss to pass. The National Renewable Energy Laboratory puts the probability of hail damaging a solar panel below 5%. Hail above 1.75 inches can cause significant damage, and 4.0mm glass resists better than standard 3.2mm — so the hail rating is a must-have specification on an Oklahoma quote, not a nice-to-have. Most panel warranties do not cover hail damage, or cover it only narrowly as an “environmental factor” — homeowners insurance, with hail as a covered peril under the dwelling section, is the usual cover. Confirm that before signing. Hail damage now accounts for about 54% of solar loss claims, averaging about $58.4 million per claim in the industry figures — commercial-scale context, so treat it as indicative rather than as a residential number.
Tornadoes are a roof question, not a panel question. Oklahoma averages about 57-65 tornadoes a year — a long-term mean of 64.7 a year from 1950-2025, 4,856 confirmed, third nationally — with 13 F5/EF5 tornadoes on record, the most recent at Moore in May 2013, and a record year in 2024 with 152. About 74% are EF0 or EF1, and peak season runs April through June, with May the peak month. Panels are not tornado-rated: an EF2 or stronger direct hit will destroy a roof array along with the roof. The protections that matter are racking and wind-uplift rating, roof condition, and insurance, not panel brand. No Oklahoma-specific design-wind figure was verified for this guide, so none is stated here. The state also sees about 55 thunderstorm days a year and 21,278 damaging-wind events since 1950 per NOAA — describe the wind risk qualitatively, and ask the installer what uplift rating the racking carries.
The roof itself. Heat and hail age Oklahoma roofs fast. When a roof has under ten years of life left, replace it before the panels go on — taking panels off and putting them back for a reroof costs thousands on its own. The reroof numbers are in our roof replacement guide. Standing-seam metal counts among the best solar roofs anywhere, because clamps grip the seams without a single roof penetration. There is also a program worth knowing about before the panels go up: the Oklahoma Insurance Department’s Strengthen Oklahoma Homes program offers grants up to $10,000 for IBHS FORTIFIED Home-Roof upgrades (High Wind plus Hail Supplement), with pilot zip codes reopened and a statewide rollout in 2026 covering all 77 counties. It is a roof-hardening grant, not a solar rebate — but a hardened roof is exactly what a Hail Alley array sits on.
Dust matters in the west. Western Oklahoma dust can cut output materially if panels are not cleaned — one source cites up to 40% in extreme uncleaned cases, which should be treated as an upper-bound claim rather than an Oklahoma measurement. In the east, rain usually does the cleaning; in the west, plan on an occasional rinse from the ground — and never climb onto a hot July roof to wash panels.
Dealing with the climate. Nothing out of the ordinary is needed. Pick a south-facing orientation where the roof allows it, a tilt that sheds the summer cloudbursts, microinverters or optimizers so a shaded string cannot drag the whole array down, and a production estimate built on PVWatts data with the temperature derate out in the open, not hidden. Monthly netting is what makes summer work financially: air conditioning runs hardest in the same hours the panels produce most, so the most valuable kilowatt-hours are the ones the house eats the moment they are made — and surplus that does spill over still offsets evening use inside the same month.
Net Metering in Oklahoma: The Rules That Decide Your Return
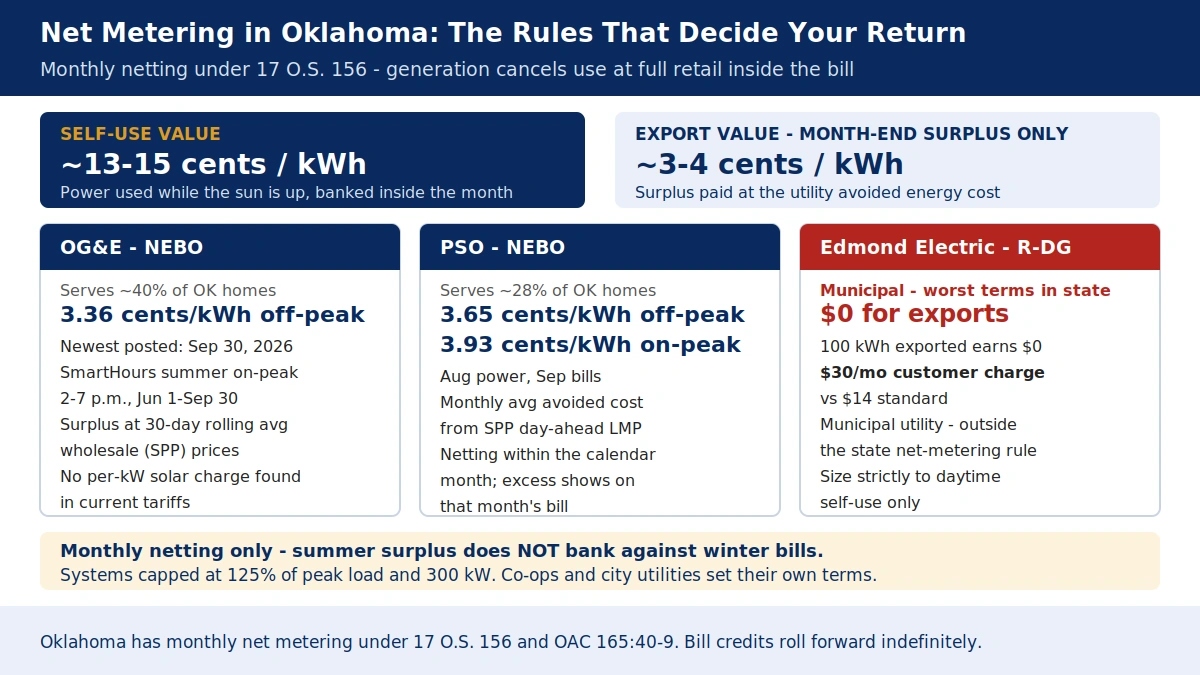
Oklahoma does have a net-metering framework — anyone who says otherwise is describing a rule that does not exist here. What the state offers is monthly netting, not annual netting, and not full retail for surplus — and the difference between those three things is the difference between a 12-year payback and a 16-year one.
The law. The framework sits in state statute 17 O.S. Section 156 and in Oklahoma Corporation Commission rules OAC 165:40-9, effective July 25, 2019. A May 2019 change raised the system cap to 300 kW and removed the old 25,000 kWh annual generation limit. There is no aggregate capacity cap, no closing deadline, and no successor proceeding pending, per EcoGen’s October 2026 check. That framework binds the OCC-regulated utilities — OG&E and PSO — and it does not bind co-ops or city utilities, which set their own terms. That split is the most important thing in this section, and it is why Edmond looks so different from Oklahoma City.
How it works. Within each monthly billing period, generation offsets consumption one-for-one at the full retail energy rate. Run the dishwasher at noon, and the kilowatt-hour your panels make cancels a kilowatt-hour you would have bought at about 13-15 cents. Only the energy part of the bill changes — the customer charge, riders, fees, and taxes stay. At the end of the month, any surplus is bought or credited at the utility’s avoided energy cost, a wholesale-level price of roughly 3-4 cents a kilowatt-hour, as a dollar credit on a later bill. EnergySage reports that bill credits roll forward indefinitely.
The sizing cap. The system may not be designed to produce more than 125% of expected peak load, with peak load taken from the 12 months before the application, and the system itself is capped at 300 kW. A system larger than 125% of peak load may be moved off net metering onto a different tariff. This is the binding constraint for most homes — 12 months of bills set the ceiling, so add an EV or a heat pump before designing the array, not after.
No per-kilowatt solar charge was found. Senate Bill 1456 (2014) lets utilities and regulated co-ops apply to the OCC for a fixed charge on customer-generators who installed on or after November 1, 2014. But no per-kilowatt solar capacity charge like Alabama’s Rider RGB — $5.41 a kilowatt a month — was found in force at OG&E or PSO. This guide states that as “not found in the utilities’ current published tariffs” rather than as a guarantee, and you should confirm it on your own bill. It is, if it holds, a genuine Oklahoma advantage worth thousands over the life of a system. Our Alabama solar cost guide shows the contrast.
OG&E — about 40% of Oklahoma homes, roughly 880,000-917,000 customers, Oklahoma City metro plus western and south-central Oklahoma. OG&E’s tariff is called NEBO, the Net Energy Billing Option, tariff sheets 70.10-70.12. The system must be 300 kW or smaller and within 125% of peak load, and the home must be on a standard time-of-use plan — SmartHours, with summer weekday on-peak hours of 2-7 p.m., June 1 through September 30. Surplus is credited at a 30-day rolling average of wholesale (SPP) prices, posted daily on OG&E’s NEBO price page. The newest posted off-peak price was 3.36 cents a kilowatt-hour on September 30, 2026, with the August-September 2026 off-peak range running 3.11-3.67 cents. From October 1 through May 31 every hour is off-peak; the higher summer on-peak price applies only June 1 through September 30. EcoGen characterizes the summer on-peak surplus price as “near 10 cents a kilowatt-hour” — no exact posted summer on-peak NEBO figure was verified for this guide, so no precise number is stated here. OG&E does not purchase SRECs. Credit mechanics: a dollar credit on a later bill, and once a credit has carried forward more than 24 months or passes $100, either side may choose a one-time payment; credits move with the customer to a new OG&E account. OG&E offers no rebate for home solar panels or home batteries. OG&E’s Solar Power Program — community solar from OG&E’s own solar farms — was taking sign-ups as of October 5, 2026, with a waitlist if full, but it is a rate choice, not a savings program. Interconnection means an application and approval before install, as standard practice; no OG&E-specific application fee or timeline was verified for this guide, so neither is stated as a figure.
PSO — about 28% of Oklahoma homes, roughly 560,000 customers, Tulsa plus eastern Oklahoma. PSO runs a NEBO tariff (rate codes 067/247/257/263) alongside a QF Standard Purchase Schedule for producers up to 300 kW. The home must take service under a standard time-of-use rate schedule and sign a Standard Electricity Purchase Agreement. Netting happens within the calendar month, and excess kilowatt-hours show on that month’s bill. Surplus is credited at the monthly average avoided energy cost from SPP day-ahead LMP at the AEPM_CSWS node, posted monthly. PSO’s table dated September 23, 2026 shows August power credited on September bills at 3.65 cents a kilowatt-hour off-peak and 3.93 cents on-peak. The monthly 2026 values run: January power credited on February bills at 6.76 cents (on-peak season only, a single figure); February to March 2.68 cents; March to April 2.21 cents; April to May 2.30 cents; May to June 2.88 cents; June to July 3.58 cents on-peak and 3.08 cents off-peak; July to August 4.20 cents on-peak and 3.62 cents off-peak; August to September 3.93 cents on-peak and 3.65 cents off-peak. Do not confuse those NEBO figures with the QF Standard Purchase Schedule, 14th revised sheet effective October 28, 2026, which prices firm power at $0.040480 a kilowatt-hour and non-firm at $0.030640, on a one-year term — that is the gross and net sale schedule for qualifying facilities, distinct from NEBO monthly netting, and a homeowner on NEBO is paid the NEBO avoided-cost table above, not the QF schedule rate.
Edmond Electric — the worst solar terms in the state. Edmond Electric is a municipal utility, outside the state net-metering rule, and it sets its own terms. Its Schedule R-DG gives no credit at all for power sent out — 100 kilowatt-hours exported earns $0. Solar homes pay a $30.00-a-month customer charge instead of $14.00 on the standard rate. Edmond Electric says it does not partner with any solar seller and warns about door-to-door sellers claiming it does. This is the worst solar economics in Oklahoma, and it directly affects the Edmond city figure above — an Edmond homeowner should size strictly to daytime self-use, because every exported kilowatt-hour is a gift to the utility.
The co-ops write their own rules too. Oklahoma Electric Cooperative, in the Norman area, does offer net metering that mirrors the state structure — 300 kW or smaller, the 125% peak-load concept, retail netting within the billing period, and excess at avoided energy cost — plus a Power Export option for 300 kW to 3 MW with a separate meter at the wholesale rate. Northeast Oklahoma Electric Cooperative publishes a net energy billing rate and a monthly avoided-cost table: September 2026 at $93.43 a megawatt-hour (9.34 cents), August 2026 at $58.42, July at $44.37, June at $28.68, October 2025 at $32.72, and September 2025 at $27.08 — avoided cost varies widely month to month, which is itself a useful warning about counting on export income. For GRDA and the smaller co-ops and municipals, no specific solar buyback terms were verified for this guide. The draft says so plainly: co-op and municipal customers must get the solar rate sheet in writing before signing, because the OCC rule does not bind those utilities. Liberty Utilities is listed by EcoGen alongside OG&E and PSO as paying avoided cost for month-end surplus, but no Liberty-specific rate was verified, so it is mentioned only in passing here.
Payback: How Long Until Oklahoma Solar Pays for Itself?
Payback is where an Oklahoma system either earns its keep or does not. The answer turns on which utility sends the bill. The worked examples below run off the EcoGen anchors so every input can be checked, with EnergySage as the cross-check — and where the two disagree, this guide says so.
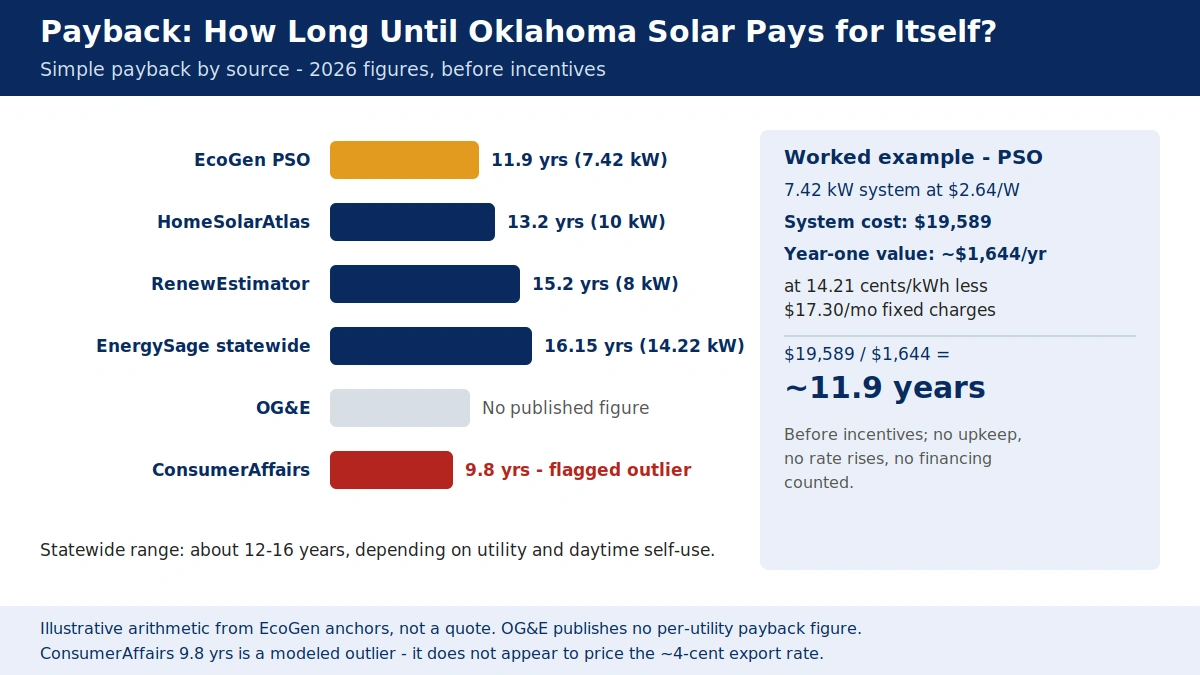
The worked example. Start with a typical 7.42 kW system at $2.64 a watt, priced at $19,589 before incentives. It puts out about 11,568 kilowatt-hours a year. No state credit and no rebate sit between gross and net here, so net cost is gross cost: $19,589. From here on, yearly savings — and with them the payback — rest entirely on the utility.
PSO is the fastest payback in the state. EcoGen’s per-utility worked example for PSO territory puts the year-one value at about $1,644 a year, using PSO’s 14.21-cent rate on a 12-month average, less PSO’s $17.30-a-month fixed charges. Simple payback works out to $19,589 divided by $1,644, about 11.9 years — call it about 12 — before incentives, counting no upkeep, no rate rises, and no financing. EcoGen’s own pages disagree slightly on the PSO figure — 11.9 years on the cost page against 12.1 years on the companies page, both October 2026 — so this guide rounds to “about 12 years” and cites the cost page. That figure covers PSO only, about 28% of Oklahoma homes.
OG&E has no published payback figure, and this guide does not invent one. OG&E is the largest utility in the state, about 40% of homes, and neither EcoGen nor any other source found in this pass publishes a per-utility payback for OG&E territory. The direction of the difference is genuinely uncertain, and the guide says so. OG&E’s retail rate is lower than PSO’s — about 12.5 cents against about 14.2 cents on EIA-861 2025 figures — which would lengthen payback at the same system cost. But OG&E’s summer on-peak surplus price is higher than PSO’s, which shortens payback for summer exporters. A homeowner in Oklahoma City should work the payback from their own OG&E bill, using the NEBO prices in the section above, rather than borrowing PSO’s 12 years or the statewide 16.
The statewide figure sits between the two. EnergySage puts it at 16.15 years on the 14.22 kW average system, with $27,942 in 25-year savings and a 77% offset. It is longer than EcoGen’s PSO figure mostly because the system is nearly twice the size and the model prices exports low. HomeSolarAtlas gives a simple benchmark payback of 13.2 years on a 10 kW system, and RenewEstimator gives 15.2 years on an 8 kW system — both inside the same 12-16 year band. For the state as a whole, a defensible line is about 12-16 years, depending on utility and on how much of your power you use while the sun is up.
| Case | Simple payback | Source |
|---|---|---|
| EcoGen PSO (7.42 kW) | ~11.9 yrs | EcoGen Index, Sep-Oct 2026 |
| EnergySage statewide avg (14.22 kW) | 16.15 yrs | EnergySage, Nov 2026 |
| HomeSolarAtlas benchmark (10 kW) | 13.2 yrs | HomeSolarAtlas, Aug 2026 |
| RenewEstimator (8 kW) | 15.2 yrs | RenewEstimator, Jul 2026 |
| OG&E | No published figure | None found — not invented here |
| ConsumerAffairs modeled | 9.8 yrs | ConsumerAffairs, 2026 — flagged outlier |
The flagged conflict. ConsumerAffairs reports a 9.8-year payback with $43,701 in 25-year savings on a $37,480 typical install. That is a modeled estimate that does not appear to price the roughly 4-cent export rate, and it sits far outside the EcoGen and EnergySage band. Do not present 9.8 years as a verified Oklahoma payback, and do not let a quote cite it for an OG&E or PSO home.
Edmond Electric is the longest payback in the state — by direction, not by number. No worked Edmond payback was verified for this guide, so no number is stated. The direction is clear: no export credit at all plus a $30-a-month customer charge means every exported kilowatt-hour earns nothing and every month costs $16 more than a non-solar home’s customer charge. An Edmond system only earns its keep on power the house uses the moment it is made.
What moves the payback most. Daytime self-use is the biggest lever. Shifting the dishwasher, the laundry, the pool pump, and the EV charger into daylight hours moves kilowatt-hours out of the 3-to-4-cent export bucket and into the 13-to-15-cent self-use bucket, and no other change pays as well. Rate escalation is the second lever: Oklahoma rates rose 2.8% year-on-year to August 2026, 13.1% over three years, and 30.3% over five years per EIA, with EcoGen putting the five-year pace at 3.69% a year. At roughly 3% a year, 25-year savings grow materially over a flat-rate model — but no Oklahoma system pays back quickly on flat rates alone given roughly 14-cent power. Size comes third: oversizing past household usage pushes the marginal kilowatt-hours into exported credits worth a quarter of consumed power, while the 125% peak-load cap may push the system off net metering altogether. Fourth is financing: a solar loan carrying dealer fees can add 10-30% to the effective price, so compare cash price per watt, not the monthly payment. And the two rate cases in motion matter: OG&E filed in October 2026 seeking about $23.88 a month in average residential base-rate increases, with a decision expected in spring 2027, while the OCC approved PSO’s increase on November 5, 2026 — plus 3.55% overall residential, on top of interim increases of about $11 a month already being paid since July 2026, with no refund of the interim amounts. Rising rates help solar economics, but both are moving targets, so every rate figure in this guide is dated.
Who still comes out ahead. Four kinds of Oklahoma household clear that bar. The all-day home with a big daytime load — home offices, pool pumps, daytime cooling on smart schedules — keeps most of its production at full retail value, banked inside the monthly netting window. The PSO customer, where the published payback is about 12 years and the retail rate is the highest of the big two. The household that pairs solar with a heat pump or an EV and sizes the system to the new daytime load, staying under the 125% cap. And the backup-power buyer, who buys mainly for outage protection through tornado season and ice storms, with savings second — in that case the payback math is context, not verdict. Walk away when your home sits empty on weekdays, when you live in Edmond Electric territory and are counting on export income, or when the installer projects savings without naming your utility’s NEBO prices.
Oklahoma Incentives in 2026: Almost None
Once the federal credit is gone, most states still keep something in reserve: a state credit, a rebate, an exemption. Oklahoma has almost nothing. That sentence is the whole incentives section. It deserves to be said plainly, because most solar advertising in Oklahoma skips it.
Oklahoma has no state income tax credit for solar. The Oklahoma Tax Commission’s Form 511-CR for tax year 2025 lists no credit for a home solar system. Its only electricity-generation credit is for wind facilities that began operating before July 1, 2017. Subtracting a state credit makes a quote wrong.
There is no state sales-tax exemption for solar equipment. Oklahoma charges its 4.5% state sales tax on home solar equipment, under 68 O.S. 1354, with no exemption for it in the Sales Tax Code, and city and county tax sits on top. Have the installer list sales tax as its own separate line, and do not let a quote quietly subtract an exemption that does not exist.
No property-tax exemption was verified. No Oklahoma property-tax exemption for solar was found in this pass. Do not assume the added home value escapes tax — ask the county assessor how solar is valued before signing. One weak site, oklahomastatesolar.org, claims both a “100% sales tax exemption” and, elsewhere on the same page, “no property or sales tax exemptions” — internally contradictory and wrong on the sales-tax claim, so that site is not cited anywhere in this guide.
No Oklahoma utility pays a rebate for panels or batteries. Not OG&E, not PSO, not any co-op or municipal utility. No check arrives at purchase, anywhere in the state. An installer who promises an Oklahoma utility rebate is either confused or selling something else. OG&E and PSO do run efficiency programs for other measures — LEDs, heat pumps, insulation — but not for solar. The OMPA WISE heat-pump rebates of $175-$250 a ton for residential customers in 2026 exist for Edmond and other OMPA member-city customers, but they are heat-pump-only, not solar.
Oklahoma has no Solar for All program open for households. Oklahoma had no state award under the program. The EPA ended the Solar for All grants in August 2025. Federal courts ruled the termination unlawful in September 2026, and the EPA was weighing an appeal as of October 1, 2026. The multistate grantee Inclusive Prosperity Capital still listed its program as paused on October 5, 2026, and no household application route was found. There is no way for an Oklahoma household to apply for it.
Federal home energy rebates have not launched in Oklahoma at all. The Oklahoma Department of Commerce State Energy Office holds a total allocation of $129,152,880 — about $129 million per the National Housing Trust tracker of March 5, 2026 — with HEAR and HOMES applications conditionally approved. The program page says the request for applications is “coming soon,” with no launch date, and the program was verified as not launched as of November 4, 2026. Even when it does launch, HEAR will not pay for solar. It pays for electrification — heat pumps, heat-pump water heaters, electrical panels, and insulation-related wiring — never for panels, batteries, EV chargers, or windows.
| Item | Value | Notes |
|---|---|---|
| OK income tax credit | $0 — none exists | Form 511-CR, tax year 2025, lists no solar credit |
| OK sales-tax exemption | None — 4.5% state tax applies | 68 O.S. 1354; city/county tax on top |
| OK property-tax exemption | None verified | Ask the county assessor how solar is valued |
| Rebate for panels or batteries | $0 — none exists | No OK utility pays one |
| Solar for All | $0 — no program open for OK households | EPA ended grants Aug 2025; program paused Oct 5, 2026 |
| HEAR / HOMES rebates | Not launched | OK Dept. of Commerce; $129M allocation; no launch date as of Nov 4, 2026; HEAR never covers solar |
Federal Help in 2026: $0 Tax Credit — but the §48E Lease Route Is Legal
In 2026 the federal story fits in a single paragraph — which is exactly why so much solar advertising still gets it wrong. In Oklahoma the paragraph has a second half that Alabama does not get, because the lease route that saves other states is open here.
A system you own and install in 2026 earns no federal tax credit at all. The One Big Beautiful Bill Act (P.L. 119-21, signed July 4, 2025) ended the Residential Clean Energy Credit (§25D, 30%) for systems placed in service after December 31, 2025. IRS fact sheet FS-2025-05 confirms that completion is the date that counts: a deposit paid in 2025 buys nothing if the crew finished the job in January 2026. That same date closed the §25C credit for efficient home improvements. A 2026 cash or loan quote that still takes off 30% is priced under a law that no longer exists — have the installer take it off and quote again. SolarReviews’ own Oklahoma incentives page still shows a $5,502 credit in its totals — that is the stale 30% figure, and it is excluded from every number in this guide.
Leases and PPAs are open in Oklahoma — unlike in Alabama. The commercial clean-electricity credit (§48E, 30%) still lives for systems a company owns instead of the homeowner, for systems in service by December 31, 2027, with construction begun by July 4, 2026 per IRS Notice 2025-42. With an Oklahoma lease, the company claims that credit and passes part of the value on as a lower monthly payment. DSIRE’s third-party PPA map (May 2026, updated March 2026) lists Oklahoma as authorized, citing Attorney General Opinion 2018-5: leases and PPAs are allowed inside incorporated areas — inside city and town limits — while leases only are allowed in unincorporated areas, where PPAs are prohibited. A third-party owner is not a “retail electric supplier” or a utility under that opinion. That is a genuine Oklahoma advantage over its southern neighbor, where residential PPAs are prohibited outright and no lease provider operates at all. Our Alabama solar cost guide shows the contrast.
Two caveats before you sign a lease. First, the Attorney General opinion did not address co-op service territories, and contemporary reporting from August 2018 notes that PPAs could not be executed inside electric cooperatives’ certified territories — so a rural or co-op-territory customer should confirm PPA availability in writing before counting on it. Second, no specific national lease or PPA provider’s current Oklahoma availability was verified in this pass, so no provider is named here — EnergySage city pages may show generic lease or PPA estimates, but those should be treated as national templates unless an Oklahoma provider is named on the page. The full 2026 federal picture sits in our federal tax credits guide, and lease-versus-buy gets a detailed walk-through in our national solar cost guide.
HEAR never pays for solar. Income-qualified households can still get up to $8,000 from the Home Electrification and Appliance Rebates program in 2026 — but that money funds electrification, not panels. Under HEAR, money flows toward heat pumps, heat pump water heaters, electrical panels, and insulation-related wiring work. Panels, batteries, EV chargers, and windows all sit outside it. Since the Energy Department’s Notice 26-2 of September 1, 2026, the program covers electric-to-electric upgrades only — no fuel-switching. Oklahoma’s own HOMES and HEAR programs have not launched at all — and no launch date exists. Folding a HEAR rebate into the solar price describes a program that does not work that way at all. HEAR can still matter to an Oklahoma homeowner. A heat pump paired with new solar panels is a common combination, and the heat pump half may qualify once the state launches, while the solar half never does.
The honest summary is this: in 2026 the federal government contributes nothing to an Oklahoma homeowner who buys solar panels outright. Unlike in Alabama, it can still contribute indirectly through a lease or, inside city limits, a PPA, because the surviving 30% commercial credit reaches homeowners through a company that owns the system. On a cash quote, the price is the price. The price on a lease quote is the price minus whatever the third-party owner passes through, and that pass-through is a number to see in writing before signing.
Permits & Licensing: What Oklahoma Requires
Oklahoma’s licensing picture is simpler than most states’ — there is no statewide general contractor license and no solar-only license — and the simplicity is itself a trap, because the licenses that do matter are easy to skip past.
The electrical work needs a Construction Industries Board license. The CIB licenses the electrical trade statewide, from apprentice to journeyman to contractor. An unlimited electrical contractor needs 12,000 verifiable hours, including 4,000 as an unlimited journeyman and 6,000 commercial or industrial, while a residential contractor needs 8,000 hours. Exams run through PSI, covering the trade plus business and law, with a pass mark of 70-75% depending on the source — the two sources differ on the pass mark, so it is flagged here as a minor conflict rather than stated as a single figure. Working as an electrical contractor without a CIB license is a criminal misdemeanor. Ask for the installer’s CIB electrical contractor number and verify it; the contract company’s name must match.
Roofing contractors must register with the CIB under the Roofing Contractor Registration Act. Ask for the roofing registration too, and check that it matches the company on your contract. For solar installers, NABCEP certification is the leading industry credential. It is worth asking about even though the state does not require it. Oklahoma City and Tulsa have their own contractor registration on top of the state license, per a June 2026 source — another reason to hire a company that already works in your city.
Permits and interconnection take time. A rooftop system in Oklahoma needs a building permit, an electrical permit, and a utility interconnection agreement, in that order — and interconnection is usually the slowest of the three. No Oklahoma-specific permit fee schedule was verified for this guide, so no fee figure appears here. The town or county building department sets it. OG&E and PSO both require an application and approval before install, and no study or application fee figure was verified for either utility — that is flagged as unverified rather than assumed to be zero. Do not assume the Alabama pattern applies here: Alabama Power charged no study fee up to 25 kW, but that is an Alabama figure, not an Oklahoma one. No Oklahoma-specific interconnection timeline was verified either; nationally, residential interconnection typically runs 2-4 weeks per Palmetto (April 2025), cited here as a national figure only. Time, not money, is the certain bottleneck here. An installer who promises permission to operate in two weeks is promising something the utility decides, not them.
HOAs can restrict solar in Oklahoma — read the documents before you sign. Multiple 2026 surveys list Oklahoma among the states with no residential solar-access law — the HOA’s covenants, conditions, and restrictions control, and an HOA can restrict or ban rooftop solar. Two low-quality sources claim that Title 60, Section 820.1 prohibits HOAs from banning solar. That claim is wrong: the actual text of 60 O.S. Section 820.1, the Airspace Severance Restriction Act, is about severing airspace for commercial wind and solar leases, expressly does not apply to domestic-use systems, and says nothing about HOAs. The claim appears to be AI-generated misattribution, copied across low-quality sites, and it is not used anywhere in this guide. Two bills that would have barred HOAs from prohibiting solar — HB 1023 and SB 618, introduced in 2023 in the 59th Legislature, to be codified at 60 O.S. Section 859 — were introduced only, with no evidence of passage found in this pass, so they are not presented here as law. Read the CC&Rs first, then secure architectural-review approval in writing before ordering panels. For condo owners the hurdle is doubled, because the roof is usually common area and the board’s approval process is the whole decision.
What Pushes Your Oklahoma Quote Up or Down
The per-watt anchor is where pricing starts, not a quote. Seven things move an Oklahoma quote by thousands of dollars, and three of them belong to this state’s climate and power market.
Labor is the reason Oklahoma is cheap — and the reason to check the crew. Oklahoma electrician pay runs below the national median — $29.33 an hour against $30.38 nationally, per BLS May 2025 — and labor is the largest soft-cost component of an install, which is part of why Oklahoma lands at $2.64 a watt against a $2.89 national average. Oklahoma ranks 39th of 51 for electrician pay, with 8,500 electricians employed in the state and a 10th-to-90th percentile range of $18.22-$44.59 an hour. A low-wage market keeps prices down, but it also means the crew’s experience matters more than the headline rate: ask how many installs the crew has done in your utility’s territory, not just how many years the company has existed. No Oklahoma-specific BLS figure for solar PV installers was found — BLS publishes state-level solar-installer wages for only 32 states, and Oklahoma was not among the ones located in this pass — so the national figure is used here and flagged as national: a median of $53,140 a year, about $26 an hour, with 31,100-31,350 jobs nationally and BLS projecting 37% growth from 2025 to 2035.
The roof itself. Heat and hail age Oklahoma roofs fast. Hot summers and UV dry out asphalt binders faster than the manufacturer rating assumes, and the spring hail line bruises anything that is not Class 4 rated. When a roof has under ten years of life left, replace it before the panels go on — taking panels off and putting them back for a reroof costs thousands on its own. The reroof numbers are in our roof replacement guide. Standing-seam metal — common on Oklahoma farmhouses and newer builds — counts among the best solar roofs anywhere, because clamps grip the seams without a single roof penetration. Before the panels go up, check the Strengthen Oklahoma Homes grant in the climate section above: up to $10,000 for a FORTIFIED roof is worth pursuing first, because a hardened roof is what the array sits on for 25 years.
Hail detailing. In Hail Alley, the hail specification is a line item, not a footnote. UL 61730 / IEC 61730-rated panels, 4.0mm glass rather than standard 3.2mm, and racking rated for local wind uplift all cost more than the cheapest bid. A quote that matches a cheaper state dollar for dollar is probably missing the hail work. Ask where it is. After a storm, get the array inspected before it is re-energized if there is any visible damage, and tell the homeowner’s insurance the system exists — most policies cover it once declared, with hail as a covered peril.
Panel tier. Premium panels cost 10-20% more per watt than value-tier panels. In Oklahoma that premium buys two things that matter: better high-temperature performance and better low-light performance on cloudy, humid afternoons. Tight roof space makes paying extra for efficiency worth it. Out on the open plains, a large unshaded roof usually favors cheaper value-tier panels. Premium n-type panels also degrade more slowly — 0.25-0.5% a year, holding 91-93% of rated output at year 25, against the fleet median of about 0.5% a year and about 88% at year 25 per NREL — which matters more in a state where the panels will bake every summer for a quarter century.
Inverter choice. A string inverter costs less upfront. Microinverters or optimizers cost more but generate more on roofs with partial shade — and Oklahoma roofs, with their live oaks, pecans, and dormers, carry shade more often than installers admit. Microinverters also watch each panel on its own, so one shaded panel cannot drag the whole string down with it. A string inverter typically lasts 10-15 years, so one replacement is expected inside the life of the system; microinverters typically carry about 25 years. Each type gets costed out over its full life in our inverter replacement guide — but note that guide is national, and its dollar figures are national, not Oklahoma-specific.
The electrical panel. Plenty of Oklahoma homes still run on 100-amp service — especially the brick ranches and split-levels built from the 1960s to the 1980s — and a solar install often forces the question. A panel upgrade to 200 amps runs $1,500-$4,000 nationally, per our electrical panel upgrade guide, and it is the most common surprise add-on in Oklahoma quotes. Settle whether the quote covers it before you sign, not once the electrician is already in your driveway. No Oklahoma-specific panel-upgrade dollar figure was verified for this guide, so the national figure is cited as such.
Financing terms. Cash buys the best long-term return. A $0-down loan carries dealer fees of 10-30% of the cash price, sometimes over 50%, hidden inside the amount financed, per the Consumer Financial Protection Bureau’s August 2024 market spotlight — a national figure, but one that applies to Oklahoma quotes exactly the same way. A lease or PPA is the third path in Oklahoma, and it is legal here in a way it is not in Alabama — see the federal section above — but a lease quote should be compared on its monthly payment and its escalator, not on a headline price, because the homeowner never owns the system. Community solar is the fourth path, and it is thin here. OG&E’s Solar Power Program is the only verified community-solar option for Oklahoma homeowners, it is a rate choice rather than a savings program, and no general community-solar subscription was verified for this guide.
Maintenance and lifespan. Panels keep producing for 25-30 years of productive service, past the warranty, at reduced output. Product warranties typically run 10-25 years for materials and workmanship; performance warranties typically run 25-30 years, guaranteeing 80-92% of rated output at year 25 depending on tier. Maintenance is minimal — occasional cleaning, which matters more in dusty western Oklahoma, and an annual production check — because there are no moving parts. No Oklahoma-specific lifespan, degradation, or maintenance figures exist; every figure in this paragraph is national, and it is flagged as such.
Batteries in Oklahoma: Worth It?
A battery is the most consequential add-on in an Oklahoma solar project. It can add $15,000 or more to the job, and whether it earns that money back turns on a question Oklahoma answers differently from the states around it.
Battery cost. Adding 13.5 kWh of storage runs about $15,647 installed (EnergySage, July 2026, a national figure; this guide verified no Oklahoma-specific battery price). Edmond-specific pricing runs higher: about $18,200 for 13 kWh of storage, or $1,400 a kilowatt-hour (EnergySage, November 2026). An owner-installed battery from 2026 gets no federal credit either: §25D covered storage too, and it closed on the same day. National prices for the main battery models sit in our solar battery cost guide.
No battery program stacks on top. No Oklahoma utility runs a battery incentive, and EnergySage confirms there are no state-specific battery incentives in Oklahoma. The grid pays the battery nothing. What it earns is the gap between the export rate and the retail rate on every kilowatt-hour it stores and releases later. On OG&E and PSO that gap runs roughly 10-11 cents a kilowatt-hour — real, but narrower than in a state with no net metering at all, because monthly netting already banks daytime solar against evening use inside the same month. Storing 10 kilowatt-hours a day and releasing them after dark saves about $1.00-$1.10 a day, roughly $400 a year. That is a decades-long return on a $15,647 battery, before degradation. Arbitrage exists, but it is too small on its own to carry the cost. In Oklahoma it is smaller than it looks at first glance, precisely because the monthly netting rule already does part of the battery’s job for free.
Backup is the real case in Oklahoma. Tornado season runs April through June, ice storms take down lines in winter, and the whole state loses power to the severe thunderstorms that roll through every summer. A battery keeps the refrigerator, the well pump, medical equipment, and a window unit running through an outage that can stretch a day or more in rural territory. That is a resilience value, not a financial return, and it should be weighed as one. A battery that never earns back its cost in arbitrage can still be worth buying for a household that cannot afford to lose cooling in July or heat in January. For most households a generator still covers the house for less money. A battery offers something different instead: quiet, automatic power with nothing to refuel, and no carbon monoxide risk in a garage during an ice storm.
The payback verdict. In Oklahoma, a battery does not pay for itself on arbitrage alone. The daily spread is real but the battery is expensive, monthly netting already captures much of the value, and no program payment closes the gap. Buy the battery as backup. Size it for the loads that matter in an outage, not for the whole house, and treat the spend as resilience, not as an investment.
Getting Quotes in Oklahoma: The Checklist
Oklahoma is a good state to buy solar in — cheap installs, strong sun, and a net-metering rule that actually works — but only for a homeowner who checks the utility terms before the sales pitch. Use this checklist on every bidder, and do not sign until every line has an answer in writing.
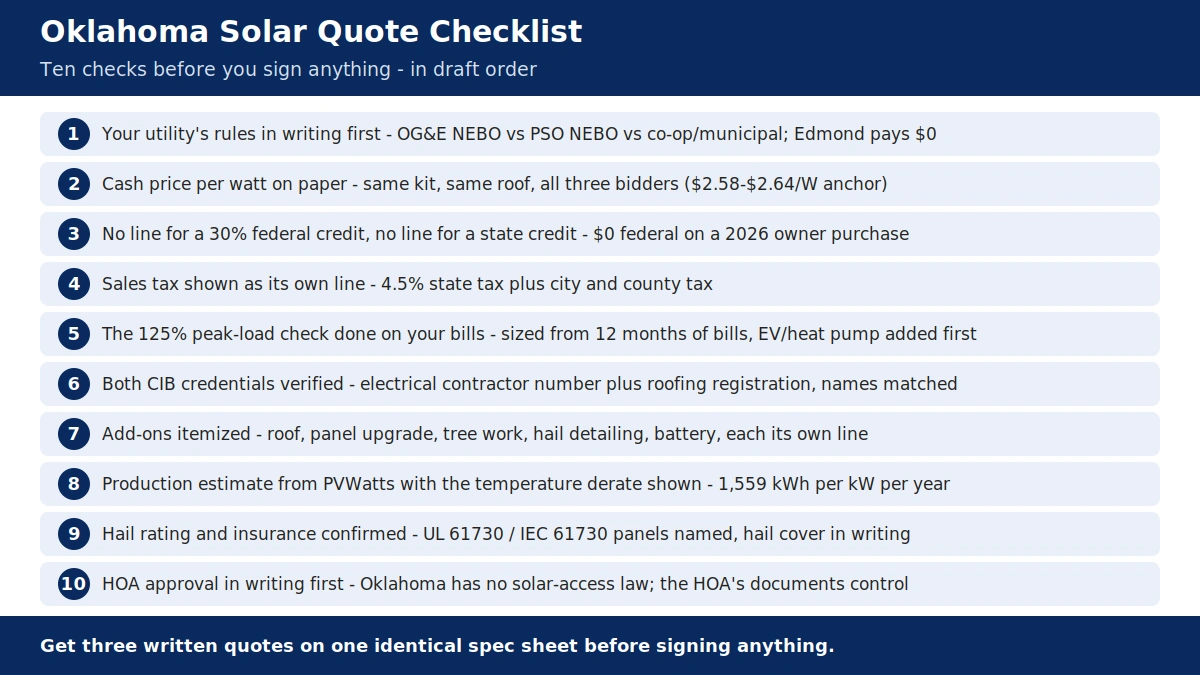
The ten-item quote checklist:
- Your utility’s rules, in writing, first — OG&E’s NEBO prices, PSO’s NEBO table, or your co-op or municipal utility’s own solar rate sheet. Export price and monthly customer charge decide the payback before anything else — and Edmond Electric pays $0 for exports.
- Cash price per watt, on paper — same kit, same roof, all three bidders. The Oklahoma anchor is $2.58-$2.64 a watt; a quote far above it needs an explanation, and a quote far below it needs a closer look at what was left out.
- No line for a 30% federal credit, no line for a state credit — a 2026 owner purchase gets $0 federal, and Oklahoma has no state credit, no sales-tax exemption, and no rebate. Any quote still deducting one of them is priced under a dead law or an imaginary one. Ask for it to be removed.
- Sales tax shown as its own line — 4.5% state tax plus city and county tax applies to solar equipment in Oklahoma, and a quote that omits it understates the cash price.
- The 125% peak-load check done on your bills — the system sized from 12 months of your bills, capped at 125% of peak load, with any planned EV or heat pump added as load first. A quote that sizes from roof area alone is guessing.
- Both CIB credentials verified — the installer’s CIB electrical contractor number and roofing registration, checked on the board’s website, with names matched to the contract. NABCEP certification is a plus.
- Add-ons itemized — roof work, panel upgrade, tree work, hail detailing, and battery, each shown as its own line, not buried in the per-watt price.
- Production estimate from PVWatts, with the temperature derate shown — the anchor is about 1,559 kilowatt-hours per kilowatt a year, not nameplate wattage, and not an annual average that hides what the summer heat takes away.
- Hail rating and insurance confirmed — UL 61730 / IEC 61730 panels specified by name, and homeowners insurance confirmed in writing to cover hail as a peril on the array before signing.
- HOA approval, in writing, first — since Oklahoma has no solar-access law, the HOA’s documents control, and approval must come before panels are ordered.
Buy, lease, or community solar? Buying wins over 25 years for homeowners with high daytime use, PSO territory terms, or a backup-power reason to buy. It keeps the system, the resale value, and every kilowatt-hour of self-use at full retail. Leasing wins for homeowners who want no upfront cost and no maintenance, because the §48E route is legal in Oklahoma and the third-party owner can claim the surviving credit — but only inside city and town limits for a PPA, and only with the escalator and the buyout terms read in full. Community solar wins for renters, condo owners, and homes whose roofs are shaded or unsuitable. In Oklahoma that mostly means OG&E’s Solar Power Program, a rate choice rather than a savings program: it asks for no roof at all, you subscribe to a nearby solar farm, and the bill credits trim your electric bill — but in Oklahoma that subscription is still a narrow product, not a general one.
Sources & methodology
Cost anchors (per watt, system size, totals):
- EnergySage state page, Nov 2026, updated Oct 30: $2.58/W; 14.22 kW average; $36,644 total; $31,147-$42,141 range; 16.15-yr payback; $27,942 25-yr savings; 77% offset; 5 kW $12,884; 10 kW $25,767
- EnergySage city pages, Nov 2026: Oklahoma City $2.55/W, 13.46 kW, $34,359, 16.81 yrs, $21,071; Tulsa $2.58/W, 12.56 kW, $32,394, $27,535-$37,253 range, 12.82 yrs, $43,003; Norman $2.59/W, 12.9 kW, $33,470, $28,450-$38,490 range, 16.49 yrs, $20,745; Edmond $2.56/W, 16.23 kW, $41,469, 17.34 yrs, $23,338; Lawton $2.52/W, 15.99 kW, $40,312, 14.34 yrs, $42,497; Enid $2.50/W, 15.1 kW, $37,779, 16.74 yrs, $26,248; Broken Arrow $2.57/W, 13.26 kW, $34,154, 22.22 yrs, $6,688, plus a duplicate Tulsa County page at $2.49/W, 17.93 kW, $44,610, 15.9 yrs, $39,552; Owasso $2.51/W, 17.55 kW, $44,120, 19.36 yrs, $21,412; Altus $2.60/W, 13.57 kW, $35,242, 11.74 yrs, $48,339; Choctaw $2.52/W, 16.13 kW, $40,658, 17.69 yrs, $21,680; Sapulpa $2.60/W, 11.53 kW, $29,907, 16.19 yrs, $18,735
- EnergySage top installers, Oct 2026: Affordable Solar; Beall Power Solutions (Edmond); Okie Solar (OKC); Palmetto Energy; Tribe Solar and Electric
- EcoGen Solar Cost Index, Sep 2026, prices as of Sep 25: $2.64/W; 7.42 kW typical from the Berkeley Lab 2025 median, 121 OK systems; $19,589 total; 1,559 kWh/kW/yr; 11,568 kWh/yr; 6th lowest of 51; PSO payback 11.9 yrs on the cost page vs 12.1 yrs on the companies page, both Oct 2026; OG&E no figure; neighbors AR $2.56, TX $2.57, NM $2.71, MO $2.74, KS $2.87, US $2.89; OK rates +3.69%/yr over 5 yrs; average use ~1,079 kWh/mo
- SolarReviews cost page, Nov 2026: $2.64/W; 7.0 kW average; $19,618 total; its $13,733 “after tax credit” column is stale and excluded
- SolarReviews incentives page, Nov 2026: $2.62/W; 7 kW; $18,340 total; its $5,502 “tax credit” is stale and excluded
- HomeSolarAtlas, updated Aug 27, 2026: $2.62/W benchmark; 10 kW $26,200; planning yield 1,490 kWh/kW/yr; simple benchmark payback 13.2 yrs
- RenewEstimator, data compiled Jul 25, 2026: $2.60/W; 8 kW $20,400; payback 15.2 yrs; rate 13.4 cents; 5.0 sun hrs; “Marginal” verdict
- TheGreenWatt, 2026: $2.60/W; 5 kW $13,000; EIA 2024 rates and NREL Q1 2024 benchmarks, older inputs, corroboration only
- ConsumerAffairs, 2026: $2.61/W; $37,480 typical install; payback 9.8 yrs; 25-yr savings $43,701; modeled outlier, flagged, not headlined
- poweroutage.us, updated Apr 13, 2026: $3.11/W; 5 kW $15,650; older methodology, corroboration only
- oklahomastatesolar.org, 2026: $2.32/W claimed, “100% sales tax exemption,” Title 60 Section 820.1 HOA claim; all contradicted by primary or stronger sources, excluded
- Edmond battery pricing, EnergySage Nov 2026: 13 kWh storage ~$18,200, $1,400/kWh
Rates:
- EIA Electric Power Monthly Table 5.6.A, Oct 2026 release: OK 14.82 cents/kWh Aug 2026; US 18.16 cents; 13th-lowest of 51; 18.4% below US average; +2.8% YoY to Aug 2026; +13.1% over 3 yrs; +30.3% over 5 yrs; Aug bill $251.28 at 1,696 kWh; May 2026 13.38 cents, US 18.44 cents, +3.4% YoY; via Energy Factbook and priceofelectricity.com, updated Nov 3-5, 2026
- EcoGen: 12-mo average ~13.81 cents/kWh Sep 2025-Aug 2026; average bill ~$148.39/mo 12-mo average
- EIA Form 861 via electricrates.org, Oct 16, 2026: OG&E ~12.5 cents/kWh 2025 average, ~37.8% of OK residential customers, standard tariff ~$13.32/mo customer charge plus riders, ~12.99 cents all-in at 900 kWh; PSO ~14.2 cents/kWh 2025, ~560,000 customers; EcoGen uses $17.30/mo fixed charges in its PSO payback
- Tulsa Flyer, Oct 3, 2026: OG&E rate case filed Oct 2026 seeking ~$23.88/mo average residential base-rate increase, decision expected spring 2027; interim proposal $0.55/mo in 2026 rising to $4.41/mo by 2031 per oklahomastatesolar.org, secondary source, indicative only
- Tulsa Flyer, Nov 5, 2026: OCC approved PSO +3.55% overall residential increase, on top of interim ~$11/mo already paid since July 2026, no refund of interim amounts
Net metering and buyback:
- 17 O.S. Section 156 and OAC 165:40-9, rules effective Jul 25, 2019: system cap raised to 300 kW, 25,000 kWh annual generation limit removed May 2019; no aggregate cap, no closing deadline, no successor proceeding pending per EcoGen Oct 2026
- S.B. 1456 (2014) fixed-charge authority; no per-kW charge found in force at OG&E or PSO, stated as not found in current published tariffs, not as a guarantee
- OG&E NEBO tariff sheets 70.10-70.12: system 300 kW or smaller, 125% of peak load, SmartHours TOU, summer weekday on-peak 2-7 p.m. Jun 1-Sep 30; surplus at 30-day rolling average SPP wholesale prices posted daily; newest posted off-peak price 3.36 cents/kWh Sep 30, 2026; Aug-Sep 2026 off-peak range 3.11-3.67 cents; Oct 1-May 31 all hours off-peak; summer on-peak surplus “near 10 cents” per EcoGen, no exact posted figure verified; credits move with the customer; one-time payment option once a credit carries >24 months or passes $100; OG&E buys no SRECs; OG&E offers no rebate for panels or batteries
- PSO NEBO tariff rate codes 067/247/257/263 plus QF Standard Purchase Schedule: monthly netting; surplus at monthly average avoided energy cost from SPP day-ahead LMP, AEPM_CSWS node; PSO table dated Sep 23, 2026, Aug power credited on Sep bills 3.65 cents off-peak, 3.93 cents on-peak; monthly 2026 values Jan-Feb 6.76 cents, Feb-Mar 2.68, Mar-Apr 2.21, Apr-May 2.30, May-Jun 2.88, Jun-Jul 3.58 on-peak / 3.08 off-peak, Jul-Aug 4.20 / 3.62, Aug-Sep 3.93 / 3.65; QF SPS 14th revised sheet effective Oct 28, 2026, firm $0.040480/kWh, non-firm $0.030640/kWh, 1-year term, distinct from NEBO
- Edmond Electric Schedule R-DG, EcoGen incentives page Oct 2026: no credit for exports, $30.00/mo customer charge vs $14.00 standard, no partnership with solar sellers
- Oklahoma Electric Cooperative net metering page and renewable-energy FAQs: mirrors the state structure, 300 kW, 125% concept, retail netting within the billing period, excess at avoided energy cost; Power Export option 300 kW-3 MW, separate meter, wholesale rate
- Northeast Oklahoma Electric Cooperative rates page: net energy billing rate and monthly avoided-cost table, Sep 2026 $93.43/MWh, Aug 2026 $58.42, Jul $44.37, Jun $28.68, Oct 2025 $32.72, Sep 2025 $27.08
Incentives:
- EcoGen OK incentives page: no state credit, Form 511-CR tax year 2025, only wind credit for facilities operating before Jul 1, 2017; no sales-tax exemption, 68 O.S. 1354; no property-tax exemption found; no utility rebate; OG&E/PSO efficiency programs exist for other measures, not solar; OMPA WISE heat-pump rebates $175-$250/ton residential 2026, Edmond/OMPA member-city customers, heat-pump-only
- OK Dept. of Commerce State Energy Office via heatpumppricing.com 50-state census, verified not launched Nov 4, 2026: $129,152,880 total allocation, HEAR + HER applications conditionally approved, RFA “coming soon,” no launch date; National Housing Trust tracker Mar 5, 2026: ~$129M
- Solar for All: EPA ended grants Aug 2025, federal courts ruled the termination unlawful Sep 2026, EPA weighing appeal as of Oct 1, 2026; Inclusive Prosperity Capital program paused Oct 5, 2026; no household application route found
Federal and financing:
- OBBBA P.L. 119-21 and IRS FS-2025-05: §25D and §25C $0 for post-Dec-31-2025 installs, completion date counts
- §48E 30% for third-party-owned systems, in service by Dec 31, 2027, construction begun by Jul 4, 2026 per IRS Notice 2025-42
- DSIRE Third-Party Solar PV PPA Policies, May 2026, updated Mar 2026: Oklahoma authorized, citing Attorney General Opinion 2018-5, leases and PPAs inside incorporated areas, leases only in unincorporated areas, third-party owner not a retail electric supplier; co-op-territory caveat per Utility Dive Aug 2018 and IndianaDG
- DOE Notice 26-2, Sep 1, 2026: HEAR electric-to-electric upgrades only, no fuel-switching; solar, batteries, EV chargers, windows outside HEAR
- CFPB Solar Financing Market Issue Spotlight, Aug 2024: dealer fees 10-30%, sometimes over 50%
Production and climate:
- EcoGen: 1,559 kWh/kW/yr PVWatts-based; 7.42 kW makes ~11,568 kWh/yr; OK ranks ~7th-11th nationally for sun
- GreenWatt PVWatts v8 NSRDB, Apr 2026: 1,542 kWh/kW/yr, 5.5 sun hrs/day OKC, June peak 7.25
- Palmetto: 15,303 kWh/yr for 10 kW, 1,530/kW; 5.4 sun hrs/day; Jul ~49.7 kWh/day, Dec ~32.0 kWh/day for 10 kW; 8.3 kW “typical for your home size in OK”
- HomeSolarAtlas: 1,490 kWh/kW/yr planning yield; Unbound Solar 5.1 sun hrs/day; IntegrateSun range 4.5-5.5 sun hrs/day
- Heat penalty 0.3-0.5% per degree C above 25 C cell temperature, national figure
- Hail: NOAA Storm Events Database via Mapscaping, 1950-Sep 2025, 30,254 hail events in OK; 21,278 damaging-wind events since 1950; ~55 thunderstorm days/yr; UL 61730 / IEC 61730 testing, 1-3 inch hailstones at 16.8-88.3 mph; IEC 61215 baseline, 25mm ice balls at 23 m/s, 11 impacts, less than 5% power loss to pass; NREL, probability of hail damaging a solar panel less than 5%; hail >1.75 inches can cause significant damage; 4.0mm glass resists better than 3.2mm; hail damage ~54% of solar loss claims, averaging ~$58.4M per claim, solartechonline 2025, commercial-scale context, indicative
- Tornadoes: long-term mean 64.7/yr 1950-2025, 4,856 confirmed, 3rd nationally, 13 F5/EF5 on record, most recent Moore May 2013, record year 2024 with 152, ~74% EF0/EF1, peak season Apr-Jun, May peak month
- Dust/soiling up to 40% in extreme uncleaned cases, upper-bound claim, not an OK measurement
- Strengthen Oklahoma Homes program, Oklahoma Insurance Department release via govdelivery: grants up to $10,000 for IBHS FORTIFIED Home-Roof, High Wind plus Hail Supplement, pilot zip codes reopened, statewide rollout 2026, all 77 counties eligible; roof grant, not a solar rebate
Payback arithmetic:
- The worked examples in the payback section are NestPriced arithmetic from EcoGen anchors: 7.42 kW x $2.64/W = $19,589; production ~11,568 kWh/yr; PSO year-one value ~$1,644/yr at 14.21 cents less $17.30/mo fixed charges; $19,589 divided by $1,644 ~ 11.9 yrs; OG&E no published figure, not invented; all worked examples labeled illustrative in the draft
- EnergySage’s 16.15-year statewide figure is presented alongside with the system-size difference flagged; ConsumerAffairs’ 9.8-year payback is flagged as a modeled outlier that does not appear to price the ~4-cent export rate
HOA and licensing:
- Palmetto solar-access survey, CityRuleLookup 2026 HOA survey, SolarPermitSolutions, PluggedIn Solar: Oklahoma among states with no residential solar-access law, HOA CC&Rs control
- 60 O.S. Section 820.1, Justia, 2014 statutes: Airspace Severance Restriction Act, about severing airspace for commercial wind/solar leases, expressly does not apply to domestic-use systems, says nothing about HOAs; the “solar access law” claim is AI-generated misattribution, excluded
- HB 1023 and SB 618, 2023, 59th Legislature, to be codified at 60 O.S. Section 859: introduced only, passage not verified, not presented as law
- Construction Industries Board licensing: unlimited electrical contractor 12,000 verifiable hours incl. 4,000 as unlimited journeyman plus 6,000 commercial/industrial; residential contractor 8,000 hours; exams via PSI, trade plus business/law, 70-75% pass mark per source, sources differ, minor conflict flagged; unlicensed electrical contracting a criminal misdemeanor; roofing contractors register under the Roofing Contractor Registration Act; OKC and Tulsa own contractor registration on top of state license per SimplyWise Jun 2026
Labor:
- BLS Occupational Employment and Wage Statistics May 2025: electricians 47-2111 Oklahoma, median $29.33/hr, $61,010/yr; mean $30.49/hr; 10th-90th percentile $18.22-$44.59/hr; 8,500 employed; national median $30.38/hr, $63,190/yr; OK ranks #39 of 51
- Solar PV installers 47-2231: no Oklahoma-specific BLS figure found, BLS publishes state-level wages for only 32 states, electricalcontractorsandwiring Nov 5, 2026; national median $53,140/yr, ~$26/hr, 31,100-31,350 jobs nationally, BLS projects +37% growth 2025-35, BLS Occupational Outlook Handbook May 2025
Maintenance, lifespan, warranty (national figures):
- Lifespan 25-30 years productive service; NREL median degradation ~0.5%/yr, ~88% of rated output at year 25; premium n-type 0.25-0.5%/yr, 91-93% at year 25, NREL Jordan et al. 2022 fleet analysis
- Product warranty typically 10-25 years; performance warranty typically 25-30 years, guaranteeing 80-92% of rated output at year 25 depending on tier; string inverter 10-15 years, one replacement expected; microinverters ~25 years
EXCLUDED:
- Any “after 30% credit” prices, including SolarReviews’ $13,733 “after tax credit” column and its $5,502 “tax credit” on the incentives page
- Any HEAR-for-solar claim: HEAR does not cover solar, batteries, EV chargers, or windows; electric-to-electric only since DOE Notice 26-2, Sep 1, 2026
- Any state tax credit, sales-tax exemption, property-tax exemption, or utility rebate for Oklahoma solar: none verified / none exists
- oklahomastatesolar.org’s $2.32/W state average, its “100% sales tax exemption,” and its Title 60 Section 820.1 HOA claim: contradicted by primary/stronger sources
- ConsumerAffairs’ 9.8-year payback: modeled outlier, flagged, not used as the headline payback
- OG&E summer on-peak NEBO surplus price: EcoGen says “near 10 cents” but no exact posted figure verified, no precise number stated
- OG&E per-utility payback: no figure exists, not invented
- Edmond Electric worked payback: direction known, worst in state; number not verified, not stated
- OG&E/PSO interconnection application fees and timelines; OK-specific permit fee schedule; GRDA and smaller co-op solar terms; Liberty Utilities export rate; OK-specific battery price, national/Edmond figures used instead
- OK-specific monthly PVWatts production table: seasonal shape described qualitatively, Palmetto Jul/Dec daily figures used
- OK-specific design-wind figure: not verified, tornado/hail risk described from NOAA counts, not a code figure
- BLS solar-PV-installer wage for Oklahoma: not published/found, national figures used, flagged as national
- HB 1023 / SB 618 (2023) solar-access bills: introduced only, not presented as law
- The brief’s premise that “Oklahoma has NO statewide net metering mandate”: INCORRECT, Oklahoma has a statutory net-metering framework, 17 O.S. 156 plus OAC 165:40-9, with monthly netting for OCC-regulated utilities, not repeated in this draft
*Disclaimer: The prices here are 2026 Oklahoma planning figures. They change by city, roof, utility territory, and contractor. Before you lock in a budget, get three written quotes from local installers. Treat the tax notes here as general information, not advice for your return. Talk to an Oklahoma tax professional before you file. Program rules change — OG&E and PSO NEBO tariffs, Edmond Electric Schedule R-DG, co-op terms — so confirm current terms with OG&E, PSO, Edmond Electric, or your own utility before signing. OG&E’s rate case was pending as of October 2026 and PSO’s increase was approved November 5, 2026 — rate figures in this guide are dated to their sources.*
What do solar panels cost in Oklahoma in 2026?
Solar panels cost $2.58-$2.64 a watt installed in Oklahoma in 2026 — about $19,589 for the typical 7.42 kW system (EcoGen, September 2026), or about $36,644 for the 14.22 kW marketplace average (EnergySage, November 2026). An 8 kW home system typically runs about $21,120 at the EcoGen rate. Oklahoma City runs $2.55 a watt, Tulsa $2.58, Norman $2.59, and Edmond $2.56. For a homeowner-owned system installed in 2026, the 30% federal credit is $0, and Oklahoma has no state credit, no sales-tax exemption, and no utility rebate to take its place.
How long does it take for solar panels to pay for themselves in Oklahoma?
About 12 years in PSO territory and about 16 years statewide on the larger marketplace average system — so roughly 12-16 years depending on your utility and how much power you use while the sun is up. EcoGen’s worked example for PSO puts a 7.42 kW system at $19,589 paying back in about 11.9 years, while EnergySage’s statewide figure is 16.15 years on a 14.22 kW system. OG&E, the biggest utility in the state, publishes no per-utility payback figure, so no OG&E number is given here. Cheap power is the drag: Oklahoma electricity costs about 14.82 cents a kilowatt-hour, so every kilowatt-hour a panel makes replaces a cheap one.
Does Oklahoma have net metering?
Yes — Oklahoma has a statutory net-metering framework in 17 O.S. Section 156 and Corporation Commission rules OAC 165:40-9, but it is monthly netting, not annual. Within each monthly bill, generation cancels consumption one-for-one at the full retail rate. Only month-end surplus drops to the utility’s avoided energy cost, roughly 3-4 cents a kilowatt-hour — 3.36 cents off-peak on OG&E as of September 30, 2026, and 3.65 cents off-peak and 3.93 cents on-peak on PSO for August power credited in September. Systems are capped at 300 kW and may not be designed to produce more than 125% of the home’s expected peak load. The rule binds OG&E and PSO; co-ops and city utilities set their own terms.
What is the difference between OG&E and PSO for solar?
Both use monthly netting under the state rule, but the prices differ. OG&E, with about 40% of Oklahoma homes, runs its NEBO tariff on a SmartHours time-of-use plan, with summer weekday on-peak hours of 2-7 p.m. from June through September, and its newest posted off-peak surplus price was 3.36 cents a kilowatt-hour on September 30, 2026. PSO, with about 28% of homes, runs its own NEBO tariff plus a purchase agreement, and its August power was credited on September bills at 3.65 cents off-peak and 3.93 cents on-peak. PSO’s retail rate is higher — about 14.2 cents against OG&E’s roughly 12.5 cents — which is why PSO’s published payback is about 12 years while OG&E publishes no payback figure at all. Neither utility was found to charge a per-kilowatt solar capacity charge.
Why is solar a bad deal in Edmond?
Edmond Electric is a municipal utility outside the state net-metering rule, and its terms are the worst in Oklahoma. Its Schedule R-DG pays nothing at all for power sent out — 100 kilowatt-hours exported earns $0 — and solar homes pay a $30-a-month customer charge instead of the standard $14. That means an Edmond system only earns its keep on power the house uses the moment it is made, and every exported kilowatt-hour is a gift to the utility. Edmond’s average system is also the largest of the five main cities at 16.23 kW, about $41,469. Edmond Electric says it does not partner with any solar seller and warns about door-to-door sellers claiming it does.
Can I still get the 30% federal tax credit for solar in Oklahoma in 2026?
No, not if you own the system. The Residential Clean Energy Credit (§25D, 30%) ended for homeowner-owned systems placed in service after December 31, 2025, under the One Big Beautiful Bill Act (P.L. 119-21), and the IRS confirmed that the completion date is what counts. But Oklahoma keeps one door open that Alabama does not: the commercial credit (§48E, 30%) survives for third-party-owned systems in service by December 31, 2027, and leases and PPAs are legal in Oklahoma under Attorney General Opinion 2018-5 — leases and PPAs inside city and town limits, leases only in unincorporated areas. A lease lets the third-party owner claim the credit and pass part of the value on as a lower monthly payment, though rural and co-op-territory customers should confirm PPA availability in writing first.
Is hail a real risk for solar panels in Oklahoma?
Yes — Oklahoma sits in Hail Alley, with 30,254 hail events on record from 1950 through September 2025, and hail is the defining equipment risk in the state. Panels rated UL 61730 / IEC 61730 are tested to withstand 1-3 inch hailstones, and the National Renewable Energy Laboratory puts the probability of hail damaging a panel below 5%. Hail above 1.75 inches can still cause significant damage, and 4.0mm glass resists better than standard 3.2mm, so the hail rating is a must-have specification on an Oklahoma quote. Most panel warranties do not cover hail damage, so confirm before signing that your homeowners insurance covers hail as a peril on the array. Tornadoes are a separate risk — about 57-65 a year — but no panel survives a direct hit, so insurance and roof condition matter more than panel brand.
Can an Oklahoma HOA block rooftop solar?
Yes. Oklahoma has no residential solar-access law, so an HOA can restrict or ban rooftop solar unless its own governing documents say otherwise. Read the CC&Rs, then obtain architectural-review approval in writing before ordering panels. Ignore any claim that Title 60, Section 820.1 protects you: that statute is the Airspace Severance Restriction Act, about severing airspace for commercial wind and solar leases, and it expressly does not apply to domestic-use systems and says nothing about HOAs. Two bills that would have barred HOAs from prohibiting solar were introduced in 2023 but were never shown to have passed, so they are not law. For condo owners the hurdle is doubled, because the roof is usually common area and the board’s approval process is the whole decision.