


Community solar cost in 2026 is $0 upfront — no equipment, no installation, no enrollment fee. You subscribe to a share of a local solar farm; your utility credits your bill for your share’s generation, and you pay the provider a subscription fee set 5–15% below the credit value. The typical household saves $60–$450 a year. There is no price tag to shop — the money question is the savings math and the contract terms, and that is what this guide prices out.
Table of Contents
Community solar is the answer to the question rooftop solar can’t answer: what if you can’t put panels on your roof? Nearly half of US households and businesses can’t host rooftop solar — they rent, their roof faces the wrong way, it’s shaded, the HOA says no, or they plan to move in two years (NREL, via DOE). Community solar lets those households subscribe to a share of a nearby solar farm and get credits on their regular utility bill. It is structured as a service, not an investment: 80–90% of the market is subscription-based (editorialge.com, 2026).
This guide does not start with a cost table, because there isn’t one — the “cost” is $0 to join. Instead it follows the real decision path: how the two-bill mechanic works (where the savings actually come from), the savings table by bill size and discount rate, subscription vs ownership, where it exists (state-by-state, because program design drives everything), the 2026 changes, the contract traps that eat the savings, and who should and shouldn’t sign up. If you want rooftop numbers instead, see our solar panel cost guide — a typical 2026 cash system runs $18,000–$24,000 (MySolarFY), a very different kind of math.
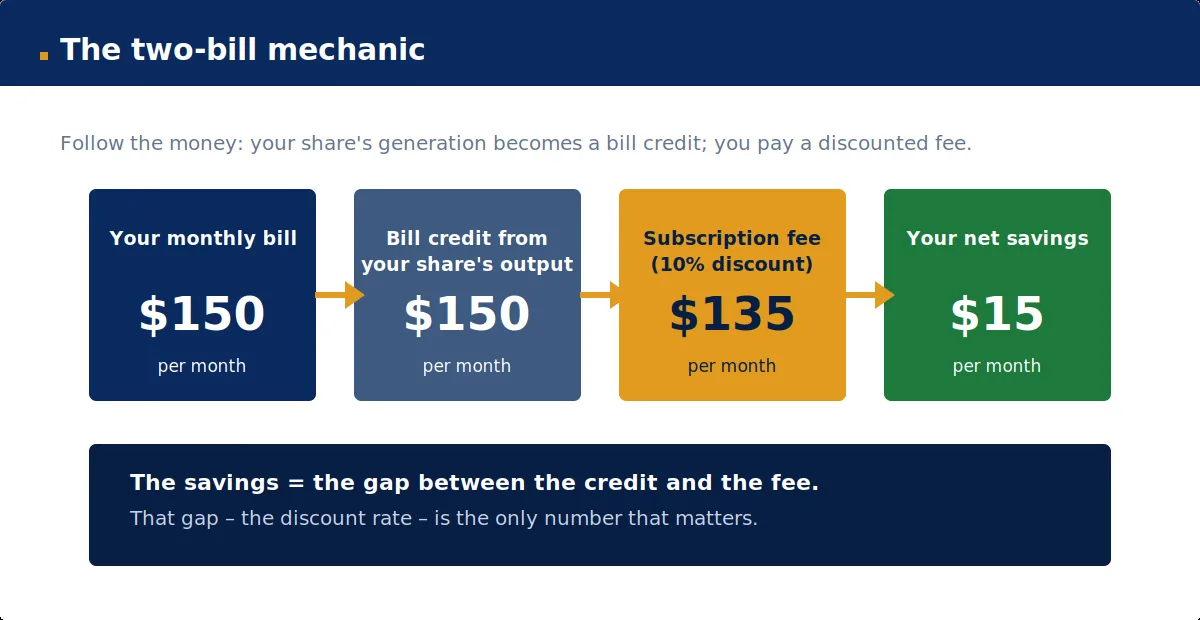
How the two-bill mechanic actually works
Community solar runs on virtual net metering. Here’s the mechanic, step by step:
1. You subscribe to a share of a solar farm. Your share’s size is matched to your typical electricity usage. You sign a subscription agreement — not a lease, not a loan — with the project developer or a platform like Perch Energy. No credit check in most programs, no equipment on your property, no installation.
2. The farm generates; the utility credits your bill. The utility meters your share’s output and applies a monetary credit to your bill. If your share produces $150 worth of electricity in a month, your bill drops by $150. You are not receiving green electrons into your home — it is a financial offset on paper (editorialge.com).
3. You pay the provider a discounted fee. The provider charges you for the credit at a discount to its value. The DOE’s standard illustration (via Joule Post, Oct 2026): your share earns a $100 bill credit; the provider charges you $90–$95 for it; you keep the $5–$10 difference.
The savings = the gap between the credit and the fee. That gap — the discount rate — is the only number that matters. A 10% discount on a $150/month subscribed bill is $15/month, or $180/year. Nobody installs anything on your home, and nothing on your roof ever needs servicing — which, as our solar panel removal & reinstall cost guide documents, is a real expense for rooftop owners.
One important limit up front: the two-bill structure means you still get a utility bill every month, and community solar credits apply per-kWh only. For commercial customers, that matters — NREL puts demand charges at 30–70% of a typical commercial bill, and community solar does not touch those (myntsystems.com).
Community solar cost and savings in 2026: the real math
Now the honest numbers. The consensus discount band across 2026 sources is 5–15% off your subscribed generation (MySolarFY, Aug 2026; solarenergysimplified.com, 2026). Reader’s Digest pegs 5–20% (Aug 2026); NREL’s “Sharing the Sun” research band runs 5–25% (via DOE). The wider bands are program- and utility-dependent — the 5–15% consensus is what most subscribers actually see.
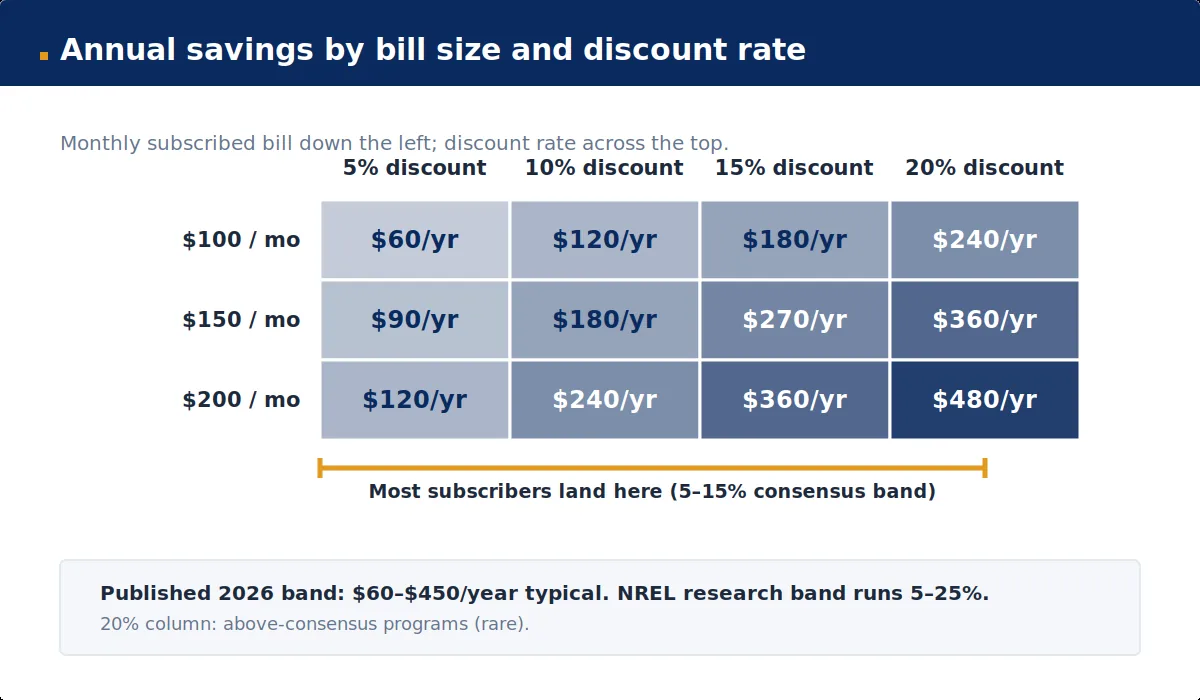
Annual savings, worked out:
| Monthly bill (subscribed) | 5% discount | 10% discount | 15% discount | 20% discount |
|---|---|---|---|---|
| $100 | $60/yr | $120/yr | $180/yr | $240/yr |
| $150 | $90/yr | $180/yr | $270/yr | $360/yr |
| $200 | $120/yr | $240/yr | $360/yr | $480/yr |
The published annual-savings band for 2026 is $60–$450/year depending on bill size and discount rate (solarenergysimplified.com, 2026). One publisher’s illustrative model puts it at $100–$290/year at the EIA national average residential rate of 18.44¢/kWh (May 2026), assuming 5–15% credit (MySolarFY, Aug 2026 — labeled illustrative, their own model). And a reality check from Joule Post’s own arithmetic (Oct 2026): “A $120/year subscription saving is about $10 a month — it will not transform a household budget.”
That honesty matters, because program marketing rarely leads with it. A Massachusetts illustrative case (editorialge.com, 2026): a $200/month bill at $0.28/kWh with a 15% subscription discount yields $360/year in savings — $3,600 over ten years at flat rates. Real, but modest. The honest framing: community solar is a utility-bill discount you sign up for in an afternoon, not an investment that pays back.
One caution on program claims: a DeKalb, Illinois community solar project (ComEd + SunVest, energized Oct 2, 2026) was announced with company projections of “more than $300/year” per subscriber alongside official estimates of $200–$300/year and a total of $246,000/year across ~1,100 households — which works out to about $224 per household, not $300. The array only just started operating, so no realized savings exist yet; treat operator projections as projections, not results.
Community solar cost: subscription vs ownership
Two models exist. The subscription model dominates 80–90% of the market — it is structured as a service, not an investment (editorialge.com). The ownership model is the minority alternative.
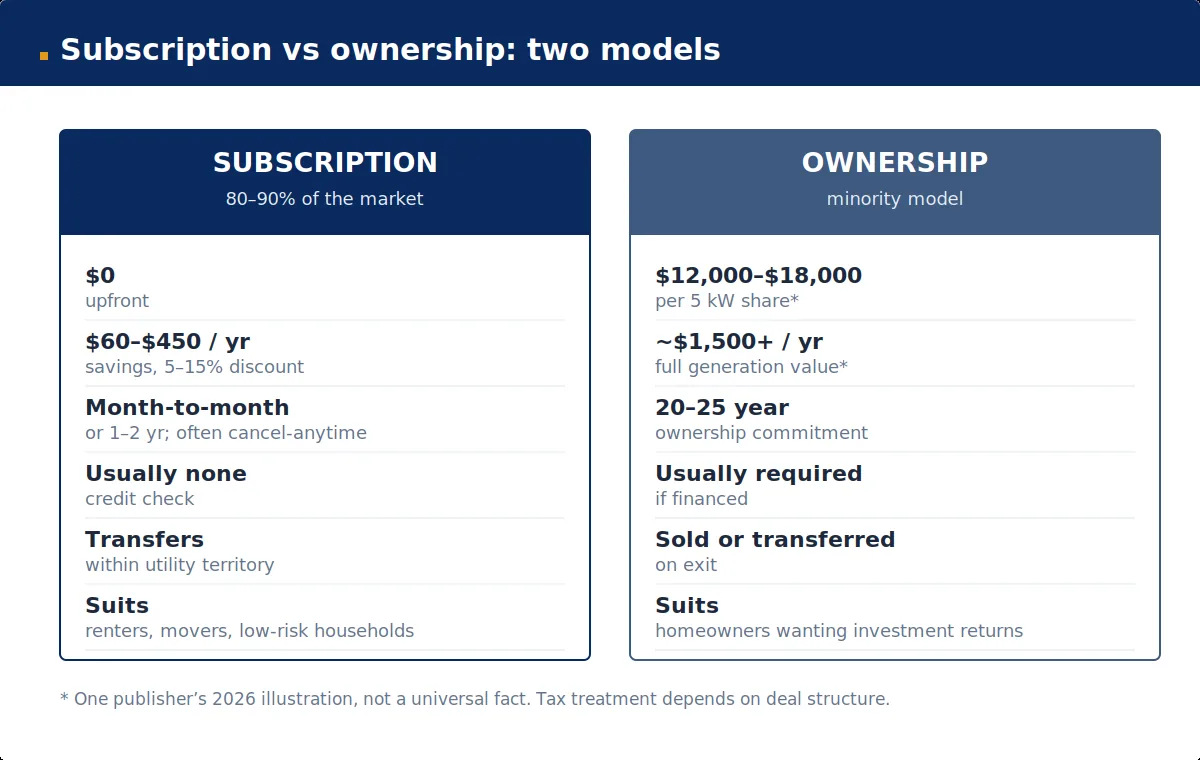
| Subscription (most of the market) | Ownership (minority) | |
|---|---|---|
| Upfront cost | $0 | $12,000–$18,000 for a typical 5 kW share* |
| Annual savings | $60–$450/yr (5–15% discount) | ~$1,500+/yr (full generation value)* |
| Contract | Month-to-month or 1–2 yr; often cancel-anytime | 20–25 year ownership commitment |
| Credit check | Usually none | Usually required (financed share) |
| Moves with you | Transferable within the utility territory | Share sold or transferred on exit |
| Who it suits | Renters, movers, low-risk households | Homeowners wanting investment-style returns |
*One 2026 analysis illustrates the ownership model with a 5 kW share at $12,000–$18,000, claimed benefits of roughly 100% of generation value (~$1,500+/year savings), and 10-year math of $22,000 in credits against an $11,200 net cost after an assumed 30% §48E credit (editorialge.com). Treat this as one publisher’s illustration, not a universal fact — individual “ownership” tax treatment depends on the deal structure, and the claimed credit math does not apply to subscriptions.
The tax line matters here. The residential clean energy credit (§25D) is $0 for 2026 under OBBBA (P.L. 119-21; IRS FS-2025-05) — and it never applied to community solar subscriptions in the first place; even when active, it was for owned systems (nuwattenergy.com, Apr 2026). The §48E Clean Electricity Investment Credit survives for business-owned systems — in service by December 31, 2027, or begun before July 4, 2026 under safe harbor (joulepost.com, Sep 2026). That credit flows to the project owner, not the subscriber. For the full credit-kill list, see our 2026 energy tax credits guide.
Community solar cost by state: where programs exist in 2026
Program design drives everything. State counts differ by definition — NREL tracks projects in 44 states + DC by project data, DOE counts 1,600+ projects across 39 states + DC, and about two dozen states have formal legislation — so “available in your state” means asking which program serves your utility, not which color the map is.
The scale: NREL’s “Sharing the Sun” data (as of January 2026) counts 11,529 MWac across 4,280+ projects in 44 states + DC, with 2024 the record year at 2,389 MWac. Wood Mackenzie (Apr 2026) puts US cumulative capacity past 10 GWdc at end of 2025, with 1,435 MW installed that year — the market contracted 25% in 2025 on mature-market slowdown (NY, Maine), with +12% growth expected in 2026. Roughly 91% of cumulative capacity sits in the top 10 states (pv-magazine-usa.com, Sep 2026).
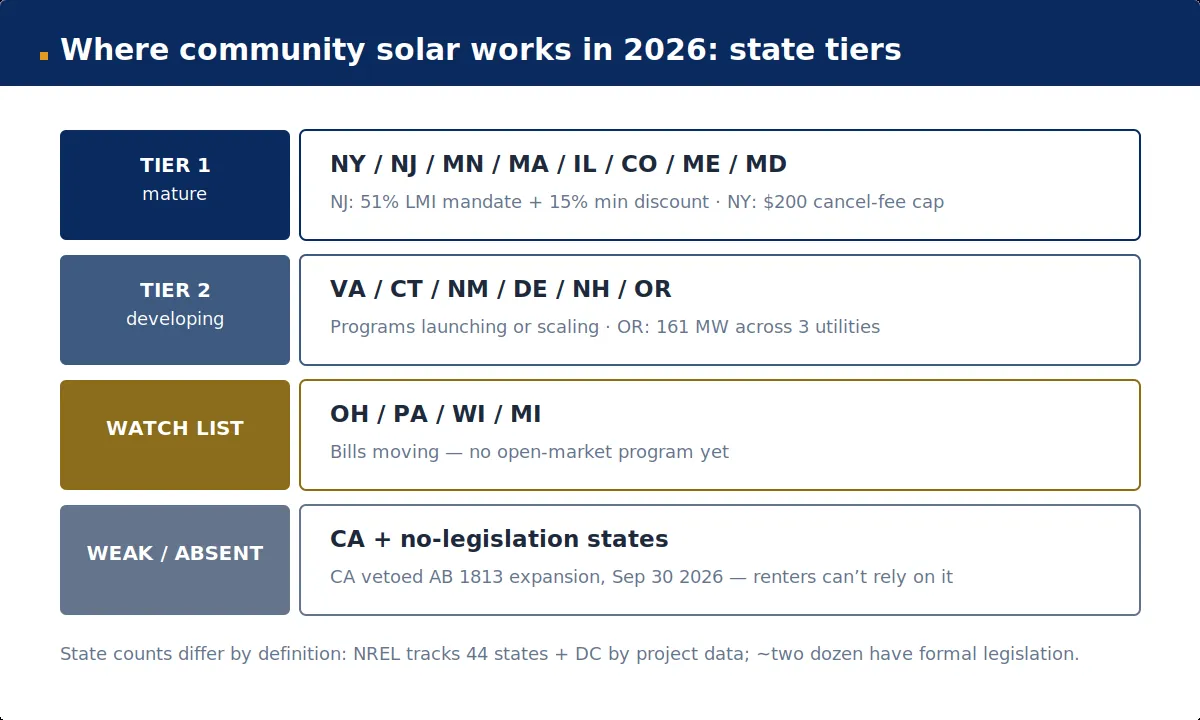
| Tier | States | What makes them work |
|---|---|---|
| Tier 1 — mature | NY, NJ, MN, MA, IL, CO, ME, MD | Stable programs + consumer protections + growth |
| Tier 2 — developing | VA, CT, NM, DE, NH, OR | Programs launching or scaling |
| Watch list | OH, PA, WI, MI | Bills moving; no open-market program yet |
| Weak / absent | CA, + no-legislation states | No enabling policy |
New York is the national leader at 1.3+ GW, with 10–15% savings under the Community Distributed Generation program and real consumer protections — including a $200 cap on cancellation fees (solarenergysimplified.com). It added 202 MW in Q2 2026 (+7%), the only state accelerating quarter-over-quarter (pv-magazine-usa.com).
New Jersey is the fastest grower: +38 MW in Q2 2026 (+17%), with a 2025 law expanding the program to 3.25 GW total. Its Community Solar Energy Program requires 51% of project capacity to serve low/moderate-income customers and guarantees a 15% minimum discount — the strongest LMI mandate in the country.
Minnesota is the pioneer (program since 2014): ~930 MWac installed, roughly half of the state’s solar is community solar, 25,000+ customers across 490+ cities (NLR). Massachusetts is mature — high electricity rates mean larger absolute savings; SMART 3.0 took effect September 2025 with a 900 MW cap. Illinois grew 50%+ under CEJA/Illinois Shines, with the ICC doubling awards to 900 MW for 2025–26 (CBRE, Jan 2026). Colorado runs Xcel’s Solar*Rewards Community, with a new inclusive program under SB 24-207 beginning in 2026. Maine leads per-capita (~700 W/person; community solar is 53% of state solar) — though over 100 developers sued to block the LD 1777 successor rules effective 2026 (CBRE). Maryland is growing with multiple providers.
Tier 2 (VA, CT, NM, DE, NH, OR) is developing — Oregon’s 161 MW allocation across three utilities is one to watch. The watch list has bills moving but no open program yet: Ohio’s HB 303 (1,500 MW) passed the House 73–2 in November 2025 with the Senate pending; Pennsylvania’s HB 504 has been stuck in Senate committee since May 2025; Wisconsin heard a 1,750 MW proposal in December 2025; Michigan bills run through the 2026 session.
California is the cautionary tale. It has 560 MW operating plus 165 MW under construction (CPUC data, Apr 2026) and ~185,000 subscribers — but Governor Newsom vetoed AB 1813 (community solar expansion) on September 30, 2026. Renters cannot rely on community solar as a near-term route in California (myntsystems.com, Oct 2026).
One more piece of context: Florida’s capacity is large but utility-owned — FPL’s SolarTogether is the nation’s largest community solar program (44 solar energy centers, 3,278 MW), but it is a utility tariff, not an open subscription market.
Community solar cost vs rooftop solar: which saves more?
The honest answer: rooftop saves far more, if you can install it. This is not a close contest on dollars — it’s a contest of eligibility.
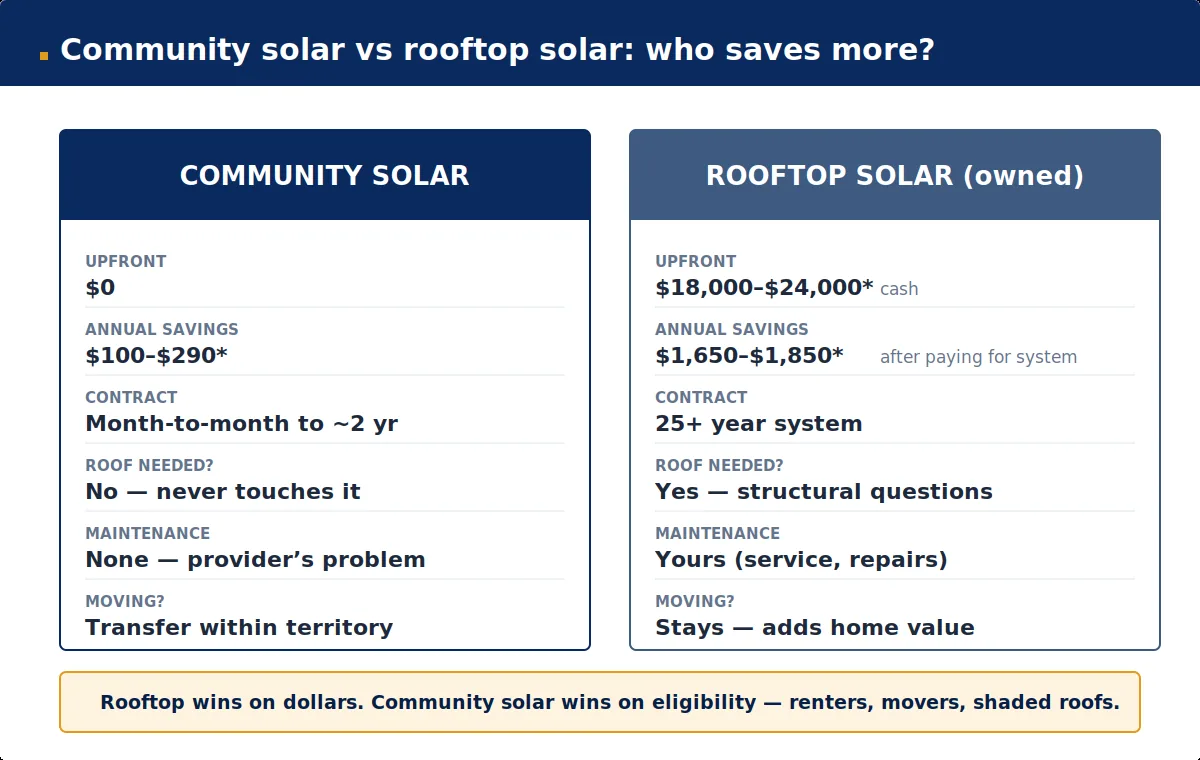
| Community solar (subscription) | Rooftop solar (owned, 2026) | |
|---|---|---|
| Upfront | $0 | $18,000–$24,000 cash* |
| Annual savings | $100–$290* | $1,650–$1,850* |
| Contract/commitment | Month-to-month to ~2 years | 25+ year system |
| Roof required | No — never touches your roof | Yes, with structural questions |
| Moves with you | Transfer within utility territory | Stays with the house (home value) |
*One publisher’s illustrative estimates (MySolarFY, Aug 2026) — rooftop cash at $18,000–$24,000 vs rooftop owner savings of $1,650–$1,850/year after paying for the system. Your utility rate, net-metering rules, and usage decide your numbers; get local quotes for both.
The rooftop side’s bigger savings come with bigger responsibilities — including the ones in our removal & reinstall guide ($200–$500/panel when the roof needs replacing) and system sizing guide (most homes land in the 6–10 kW range). Community solar’s pitch is the opposite: nothing on your roof, nothing to maintain, savings from the first bill, and you can walk away. The $0 federal credit in 2026 narrows rooftop’s edge slightly — both models now price at full price, with only project owners (not subscribers) able to claim §48E.
2026 freshness: what’s changed this year
Stale pages still imply old credits apply. They don’t. The 2026 community solar landscape runs on state programs, not the old federal credit (MySolarFY, Aug 2026). What changed:
Federal: §25D is $0 for 2026 — and it never applied to subscriptions anyway. §48E survives for business-owned projects through December 31, 2027 (safe harbor for projects begun before July 4, 2026). That credit flows to the farm owner, and it’s one reason subscription fees can stay discounted.
DOE guidance (Oct 2026): subscribers should expect at least 20% household savings with no sign-up, exit, or termination fees — and LMI programs must deliver savings (wp.joulepost.com). Treat this as the standard to hold any offer against.
State program moves: New Jersey’s +3.25 GW expansion, Rhode Island’s CRNM v2 (~40 MW, expected 2026–27), Colorado’s SB 24-207 program launch, New York’s 202 MW Q2 growth — against California’s AB 1813 veto and a 25% national market contraction in 2025 (Wood Mackenzie).
Market structure: subscriber acquisition costs fell 12% from 2024, but LMI subscribers remain the most expensive to acquire at $100/kW. Consolidation is underway — Perch Energy acquired Solstice in February 2026, and four platforms or vertically integrated developers now manage 55% of operational capacity (Wood Mackenzie). One market analysis projects 17.1% annual growth to an $11.1B market by 2033 (informedclearly.com, Feb 2026 — a market-analysis source; treat as a projection, not a fact).
Anyone promising you a 30% federal tax credit on solar in 2026 is lying. The credit is $0 for homeowner systems this year, and it never applied to community solar subscriptions at all. Solar complaints rose more than 500% from 2018–2023 (FTC, state attorneys general, BBB — via solarenergysimplified.com). If the pitch leans on a credit, it’s a scam indicator, not a selling point.
Community solar contract traps that eat the savings
The savings are real, but the contract terms decide whether you keep them. Before signing, work through this list:
Escalator clauses. Some subscriptions raise your rate 1–3% a year. The savings persist only if the escalator stays below utility rate increases (solarenergysimplified.com). The parallel trap in solar leases is instructive: below-3% is fair, 4%+ is predatory — at 4%, a below-utility payment can overtake grid costs before year 20 (legalclarity.org, citing the US Treasury).
Teaser rates. Predatory low intro discounts that reset higher are a called-out risk in community solar specifically (editorialge.com). Get the reset schedule in writing, not the first-year rate.
Cancellation fees. New York caps them at $200 — which implies most other states don’t. The DOE’s recommended standard is zero sign-up, exit, or termination fees. If your offer has a four-figure termination fee, it’s a bad offer.
“Free solar” marketing. $0 to join is standard — it’s not a special deal, and anyone presenting it as one is dressing up the baseline. Worse are the sellers layering false credit claims on top.
Cooling-off rights. The FTC’s 3-business-day cancellation rule covers in-home sales over $25 (legalclarity.org) — know it before the doorstep pitch.
Verify before signing. Check the state contractor licensing board, search state attorney-general complaints, and for low-income offers use LIHEAP or the DOE’s Clean Energy Connector to confirm the program is legitimate (legalclarity.org; solarenergysimplified.com).
Low-income access: where the savings are guaranteed
Community solar’s strongest policy case is low-income access. NLR (Jan 2026) counts at least 468 MWac of LMI-dedicated capacity operating — roughly 117,000+ LMI households at a 4 kW subscription size. Only 19.3% of tracked projects report LMI data, so the true figure is likely higher. Twenty states with legislation include LMI provisions; some programs require ~40% of capacity for LMI subscribers (informedclearly.com).
The programs that deliver from day one:
FPL SunAssist (Florida): a $5.57/kW charge against a $6.27/kW credit — credits always exceed the charge, so savings start on the first bill. An average 6 kW subscription saves about $4.20/month (~$50/year). Zero cost, no long-term contract, cancel anytime, eligibility at or below 200% of the federal poverty level (fpl.com, 2026).
Rhode Island CRNM: $0 upfront, no credit check, 10–15% bill savings against some of the highest electricity rates in the US (~$0.29/kWh RI Energy). CRNM v2 adds ~40 MW under PUC development, expected 2026–27 (nuwattenergy.com, Apr 2026).
DOE Clean Energy Connector: a digital tool linking LIHEAP recipients to guaranteed-savings subscriptions (solarenergysimplified.com). If you’re LMI-eligible, start here rather than with a doorstep salesperson.
Massachusetts SMART 3.0: minimum 90 MW set aside for 2026 plus low-income rules (CBRE). DeKalb, IL: 60% of the new 7.7 MW project’s capacity is reserved for low/moderate income households — though as noted above, its savings figures are projections, not results.
Who should (and shouldn’t) sign up
Sign up if: you rent; your roof is shaded, small, or structurally questionable; the HOA restricts panels; you plan to move within a few years (subscriptions transfer within the utility territory); or you want savings with zero commitment and zero maintenance.
Don’t sign up if: you own a suitable roof and plan to stay — rooftop’s $1,650–$1,850/year savings dwarf community solar’s $100–$290 (MySolarFY illustrative); the only offer in your territory has escalators, teaser rates, or termination fees (wait for a better program); or you live in a state with no enabling program, where “community solar” offers are likely resold products with thin discounts.
One honest middle ground: community solar is also the no-risk way to confirm your usage patterns and utility-bill mechanics before committing $18,000+ to a rooftop system. Learn what your bills look like with a subscription; buy the roof system when the numbers are right.
Key takeaways
– Community solar cost in 2026 is $0 upfront — it’s a subscription, not a purchase.
– The savings come from the credit-minus-fee gap: 5–15% off subscribed generation, $60–$450/year typical.
– Subscription dominates 80–90% of the market; ownership ($12,000–$18,000 per 5 kW share) is a minority model.
– Program design drives everything — Tier 1 states (NY, NJ, MN, MA, IL, CO, ME, MD) have real programs; California vetoed expansion in 2026.
– $0 federal credit in 2026 (and it never applied to subscriptions); §48E survives for project owners through 2027.
– Watch the contract: escalators, teaser rates, cancellation fees. NY caps fees at $200; DOE recommends zero.
– Anyone promising a 30% federal credit on solar in 2026 is lying.
Sources & methodology
Figures compiled November 2026 from NREL “Sharing the Sun” data (Jan 2026), Wood Mackenzie (Apr 2026), DOE National Community Solar Partnership guidance, state program filings (NYSERDA, NJ BPU, Illinois ICC, RI PUC, CPUC), utility program pages (FPL, Xcel, ComEd), and 2026 publisher guides (MySolarFY, editorialge.com, solarenergysimplified.com, nuwattenergy.com, Joule Post). Ownership-share figures are one publisher’s 2026 illustration (editorialge.com), not a survey; MySolarFY savings figures are labeled illustrative. Market projections (informedclearly.com) are qualified as one analysis. The DOE’s 5-million-households/$1B-by-2025 target is presented as historical 2021 context, not a 2026 achievement. Rooftop cost comparisons reference our article 4; the federal credit status references our article 5; system sizing references our article 23.
Disclaimer: Savings are 2026 US national estimates and vary by state, program, utility rate, and contract terms — verify your program’s discount rate, escalator, and cancellation terms before signing. Tax information is general and not tax advice — confirm with a tax professional. “Free to join” offers should be verified per program: $0 upfront is the industry standard, not a special deal. Community solar availability is state- and utility-specific; confirm an active program serves your address.
How much does community solar cost in 2026?
$0 upfront — no equipment, no installation, no enrollment fee in the standard subscription model. You pay a monthly subscription fee set 5–15% below the bill credit your share earns, keeping the difference as savings. The ownership alternative (a minority model) costs $12,000–$18,000 for a typical 5 kW share, per one 2026 publisher’s illustration.
How much money can I actually save with community solar?
$60–$450/year for most households — 5–15% off your subscribed generation (the consensus band; NREL’s research band runs 5–25%). On a $150/month bill at a 10% discount, that’s $180/year. One publisher’s model puts it at $100–$290/year at the national average rate of 18.44¢/kWh. It’s a bill discount, not an investment — roughly $10–$30/month.
Is community solar really free to join?
$0 to join is the industry standard, not a special deal — verify the claim per program before signing. You still pay a monthly subscription fee; it’s just set below the credit value so you net savings. The DOE’s standard: no sign-up, exit, or termination fees, and low-income programs must deliver savings.
Is community solar available in my state?
NREL tracks projects in 44 states + DC, but ~91% of capacity sits in the top 10 states. Mature Tier 1 markets: NY, NJ, MN, MA, IL, CO, ME, MD. Developing Tier 2: VA, CT, NM, DE, NH, OR. Watch list with bills moving: OH, PA, WI, MI. California vetoed expansion (AB 1813) in September 2026 — a weak market for now.
Community solar vs rooftop solar: which saves more?
Rooftop saves far more if you can install it — roughly $1,650–$1,850/year for an owned system vs $100–$290/year for a community solar subscription (one publisher’s illustrative estimates, Aug 2026). Rooftop costs $18,000–$24,000 cash upfront; community solar costs $0 and never touches your roof. Choose rooftop if you own a suitable roof and plan to stay; choose community solar if you rent, will move, or can’t host panels.
Can I cancel a community solar subscription?
Usually yes — most programs are month-to-month or short-term with cancel-anytime terms. Watch for termination fees: New York caps them at $200, which implies most other states don’t, and the DOE recommends zero exit fees. Check the cancellation terms and any escalator clause before signing; the FTC’s 3-business-day cooling-off rule covers in-home sales over $25.
Is there a tax credit for community solar in 2026?
No credit for subscribers. The residential credit (§25D) is $0 for 2026 under OBBBA — and it never applied to community solar subscriptions in the first place, even when active. The §48E credit survives for business-owned projects (in service by Dec 31, 2027); it flows to the farm owner, not to you. Anyone promising you a 30% federal credit on solar in 2026 is lying.