


Table of Contents
North Carolina is a solar paradox. It is the fifth-largest solar state in America — 10,127 MW installed, 400 MW added in 2025 (SEIA/Wood Mackenzie, September 2026) — yet most of that capacity is utility-scale solar farms, not rooftops. For a homeowner, the state offers good sun (5.25 peak sun hours a day) and cheap electricity (14.95 cents per kilowatt-hour, about 18% below the national average), but almost no state help: no state tax credit, no sales-tax exemption, and one utility rebate that is nearly exhausted. Solar here is a workable buy — if you understand which utility sends your bill, which rider you will land on, and whether the Bridge deadline still applies to you. Every figure below is sourced from 2026 data, with the federal credit correctly shown as $0.
Compare with the national solar panel cost guide for the US baseline.
How much do solar panels cost in North Carolina in 2026?
The defensible 2026 North Carolina consensus: $2.46–$2.76 per watt installed, before any incentives — and for a solar-only purchase, there are no incentives left to subtract. EnergySage’s North Carolina state page (updated November 2026) puts the state average at $2.46/W on a 14.5 kW average system costing $35,592 (range $30,253–$40,931). Two independent marketplace benchmarks corroborate the low end: Home Solar Atlas at $2.43/W (August 27, 2026) and OhmSnap at $2.44/W (pricing updated October 5, 2026, typical quotes $2.30–$2.87/W). The high end comes from the EcoGen Solar Cost Index (September 2026 edition): $2.76/W, with quotes running $2.30–$2.92/W. The national benchmark is $2.62/W (EnergySage Marketplace Report, 23rd edition, September 2026, median quoted solar-only price, H1 2026 data). North Carolina sits below it at the EnergySage anchor and above it at the EcoGen index — which is why this guide gives you a range, not a single number.
City-level figures from EnergySage (November 2026) show the same tight clustering: Charlotte $2.36/W (14.92 kW average, $35,236, range $29,951–$40,521) and Raleigh $2.53/W (14.83 kW average, $37,484, range $31,861–$43,107). Charlotte is the cheaper of the two big metros by about 17 cents a watt — roughly $1,360 on an 8 kW system.
One number needs explaining: the “typical system” size. EnergySage’s average is 14.5 kW — an average of marketplace quotes, skewed upward by large systems. Berkeley Lab’s Tracking the Sun data puts the median system actually installed at 9.76 kW (2025, 5,650 systems). Both are real; they measure different things. This guide uses an 8 kW worked example (comparable with our California, Texas, and Arizona guides) and cites both sizes where they matter.
The number-one rule of 2026 North Carolina pricing: gross = net. The §25D residential federal credit ended December 31, 2025, and North Carolina’s own state solar tax credit expired back in 2015 and was never reinstated. Several top-ranking pages still show post-credit prices — one still advertises “after the 30% federal tax credit” net prices for North Carolina. Treat those as outdated. Every figure in this guide is the price you actually pay on an owned system, unless PowerPair applies (see the incentives section) — and PowerPair requires a battery and is nearly full.
Solar panel cost by system size in North Carolina
2026 installed costs at the EnergySage anchor of $2.46/W, with the EcoGen high end ($2.76/W) alongside. These are before incentives — and for a solar-only purchase in North Carolina, there is no incentive to subtract.
| System size | Cost at $2.46/W | Cost at $2.76/W | Best fit |
|---|---|---|---|
| 5 kW | $12,300 (EnergySage’s own size table: $12,276) | $13,800 | Small home, low daytime use |
| 6 kW | $14,760 | $16,560 | Small-to-mid home |
| 8 kW | $19,680 | $22,080 | Typical home (our worked example) |
| 9.76 kW (median installed) | $24,010 | $26,938 (EcoGen) | The typical North Carolina install |
| 10 kW | $24,600 | $27,600 | Large home, heavy AC, EV |
| 12 kW | $29,520 | $33,120 | Very large home, pool + EV |
| 14.5 kW (EnergySage average) | $35,592 (range $30,253–$40,931) | — | The average EnergySage quote |
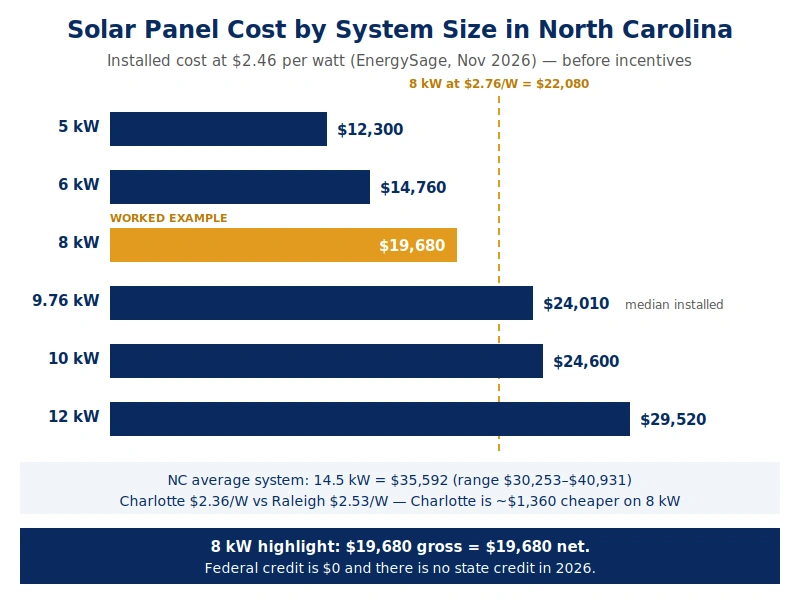
City spot-checks (EnergySage, November 2026): Charlotte’s 14.92 kW average runs $35,236; Raleigh’s 14.83 kW average runs $37,484. Do not size by the national benchmark — size by your last 12 months of kilowatt-hours. And on Duke’s Solar Choice rider, oversizing for export income is a losing design (see the Duke section below).
What drives your price per watt
Equipment tier. Panels, inverter, racking, and wiring are roughly 36% of a typical project cost nationally (EnergySage installer survey, via our California guide). Premium panels cost more per watt. In North Carolina’s humid summers, installer quality and inverter choice matter more than panel brand — there is no Arizona-style heat penalty to design around.
Coastal wind engineering. Coastal counties sit in Wind Zone III under ASCE 7-16, with design winds of 110–150 mph (Wilmington and the Outer Banks reach 150). Sites at 140+ mph need PE-stamped structural plans and reinforced attachment hardware (ecogenamerica, October 2026 — single secondary source), as do roofs where panels add more than 3 pounds per square foot or there are multiple shingle layers. If you live on the coast, ask whether wind engineering is itemized — it is a real cost, and a reason a cheap out-of-state quote can turn expensive.
Electrical panel upgrade (if needed). A national planning range of $2,500–$4,500 (NRG Clean Power, November 2026) is commonly quoted — a California-sourced national range, not a North Carolina-verified figure. One local wrinkle: the HEAR program (Energy Saver NC) can pay up to $4,000 for a panel when it supports an eligible appliance on the same application — but HEAR does not pay for solar panels, and a standalone panel upgrade does not qualify.
Permitting and interconnection. A separate electrical permit is always required under N.C.G.S. 87-43, with $100–$500 in fees, and most jurisdictions issue permits in 3–10 business days (ecogenamerica, October 2026 — installer-published; confirm locally). Ask for the interconnection fee as a line item; Duke timelines typically run weeks, and for the Bridge rider the application date is what reserves your spot.
Installer overhead. Roughly 42% of a typical project nationally is overhead, sales, and margin (EnergySage installer survey). That is why identical equipment quotes can vary widely between installers — and why three quotes are non-negotiable. In North Carolina, verify the installer’s NC electrical contractor license (N.C.G.S. 87-43: Limited, Intermediate, or Unlimited) before signing anything.
Roof age. If your roof needs replacing within 5–7 years, re-roof first — removing and reinstalling panels is a real cost that panel warranties do not cover. Our roof replacement cost guide covers the roofing side.
The 30% federal tax credit is gone — what that means for 2026 math
The §25D Residential Clean Energy Credit (30%) was terminated by the One Big Beautiful Bill Act (OBBBA, P.L. 119-21, signed July 4, 2025), Section 70506, for expenditures made after December 31, 2025. The IRS confirmed the rule in FS-2025-05 (August 21, 2025): an expenditure counts as “made” when installation is completed. If installation finishes after December 31, 2025, there is no credit.
For a homeowner-owned system installed in 2026 — cash or loan — the federal credit is $0. Gross quoted price is the real out-of-pocket price. One nuance: an unused §25D credit from a 2025 install can be carried forward to 2026 (Form 5695 instructions, 2025) — but that is a carryforward of a 2025 credit, not a credit for 2026 work.
The one surviving federal path: §48E through a lease. The Clean Electricity Investment Credit (30%) survives only for the business that owns the system — on a residential roof, that means a lease, with systems placed in service by December 31, 2027. The lessor claims the credit and may pass savings through as a lower monthly payment; you do not get a tax credit yourself. North Carolina leases are legal under HB 589 (2017) through NCUC-registered lessors (12 held certificates in early 2026). Per-kWh PPAs are effectively barred — under G.S. 62-126.5, a company paid based on a system’s electric output is treated as a public utility (DSIRE, May 2026 map). Our federal energy tax credits guide covers the full post-OBBBA landscape.
Watch for quotes still subtracting 30% — the most common stale-math trap in 2026. On a $19,680 system, the dead credit would falsely shave $5,904 off the price.
North Carolina incentives: PowerPair, property tax, and what does not exist
North Carolina’s incentive stack is the thinnest of any state we have covered — and the one real rebate in it is nearly gone. Here is the full picture, including the things that do not exist.
| Incentive | 2026 status | Value |
|---|---|---|
| Federal §25D residential credit | Expired Dec 31, 2025 — $0 | $0 |
| North Carolina state solar tax credit | Expired Dec 31, 2015, never reinstated | $0 |
| Duke PowerPair rebate | Active but nearly exhausted — pilot, first come first served | Up to $9,000 one-time: solar $0.36/W-AC up to 10 kW-AC = $3,600 max + battery $400/kWh up to 13.5 kWh = $5,400 max. Solar + battery together only, through a Duke Trade Ally; apply within 90 days of the operational date |
| Property tax exclusion | Active, no expiry | 80% of appraised value excluded under G.S. 105-275(45); file Form AV-10 with your county assessor once, by January 31 unless the county extends it. On a $20,000 system, $16,000 is excluded and $4,000 is still taxed |
| Sales-tax exemption | None — North Carolina has no solar sales-tax exemption | $0 — standard sales tax applies to solar equipment |
| §48E (lease route) | Alive through Dec 31, 2027 — only via third-party ownership | 30% to the lessor, not the homeowner |
| HEAR (Energy Saver NC) | Open in all 100 counties, with limits | Up to $8,000 heat pump; $1,750 heat pump water heater; $4,000 panel; $2,500 wiring (NC DEQ lists both $2,500 and $2,000 for wiring). Max $14,000 per dwelling. Income-qualified (up to 150% AMI). Since September 1, 2026: no fuel-switching — replacing gas, oil, or propane equipment no longer qualifies (DOE Program Notice 26-2, May 29, 2026); electric-to-electric replacements remain eligible. HEAR does not pay for solar panels themselves |
| NC Solar for All (EnergizeNC) | Never opened to households (checked October 5, 2026) | $0 — do not assume a free-solar program exists |
| SRECs | Effectively $0 value for homeowners | — |
PowerPair capacity — read this before you count on $9,000. As of November 2, 2026, Duke Energy Progress was full, waitlist only, and Duke Energy Carolinas had less than 5% of its 30,000 kW limit left — Solar Choice path only, the Bridge path full. At the 9.76 kW typical system size, that is room for roughly 150 more homes. Two caveats: that reading comes from a third-party check of Duke’s capacity table (Southern Energy capacity check, November 2, 2026; ecogenamerica’s September 24 reading had it under 10%), and Duke’s own page states no end date and publishes no remaining-capacity figure. Capacity may be gone by the time you read this. Do not sign a contract that counts on PowerPair money unless Duke has confirmed it in writing.
Worked example — 8 kW solar + 13.5 kWh battery at the $2.46/W anchor: gross $19,680 + $13,000 battery = $32,680, minus PowerPair $2,880 solar + $5,400 battery = $24,400 net if PowerPair is confirmed. Without PowerPair: $32,680 gross, $0 federal credit, no state credit. Solar-only 8 kW: $19,680 gross, $19,680 net — no rebate of any kind applies to a solar-only purchase in 2026.
A correction worth making: several pages claim North Carolina charges 0% sales tax on solar equipment. That is wrong. EnergySage (January 6, 2026) states plainly that “North Carolina doesn’t have a solar sales tax exemption,” and DSIRE-based state tables agree. On a $19,680 system, sales tax applies in full — and no exemption will remove it. The property-tax exclusion is real but narrower than some pages claim: the statute excludes 80% of appraised value, not 100%, and it is not automatic — file Form AV-10.
Duke Energy: Bridge vs Solar Choice — the deadline that changes everything
North Carolina ended full-retail net metering for new Duke customers on October 1, 2023 (the full-retail Rider NM closed to new customers September 30, 2023). Homes whose installer applied for interconnection before October 2023 were grandfathered into net metering until 2027. Everyone else chooses between two riders — and one of them closes in weeks.
Rider NMB — the Net Metering Bridge — is the good one, and it closes January 1, 2027. The tariff leaf (Rider NMB, NC Fifth Revised Leaf No. 143, effective July 1, 2026) states plainly that the rider “will be closed to new participants on and after January 1, 2027.” The 2026 enrollment capacity for Duke Energy Carolinas is 38,700 kW AC, first come first served — and your spot is reserved when a valid interconnection application lands, not when the system is installed or approved. The application date counts, not the sale date. If you are shopping in fall 2026, that date is the deadline that matters.
What the Bridge gives you: monthly use netted against production at retail rates, with no time-of-use requirement. Month-end leftovers earn the Net Excess Energy Credit — 4.53 cents per kWh (Carolinas) or 3.94 cents (Progress) — and the credit keeps reducing later bills with no yearly reset. Lock it in and you keep it for up to 15 years from your interconnection application date. Legacy net metering customers move to the Bridge (or another newer plan) by January 1, 2027 as well.
What the Bridge does not erase: a non-bypassable charge of $1.01 per kW DC per month (Carolinas tariff leaf) and a minimum bill of $22 a month (Carolinas) or $28 a month (Progress) — LIEAP/CIP recipients and low-income-built homes are exempt from the minimum bill if the system is no greater than 8 kW DC. The size cap is your estimated maximum monthly demand or 20 kW AC, whichever is less.
Rider RSC — Residential Solar Choice — is the default once the Bridge closes (Rider RSC, NC Fifth Revised Leaf No. 141, effective July 1, 2026). It requires service on a time-of-use rate with critical peak pricing (Schedule RSTC or RETC in Carolinas territory) — a different rate for every kilowatt-hour you buy, not just a compensation scheme for exports.
The Carolinas TOU rates (Schedule RSTC, effective January 1, 2026, from the tariff leaf) are: critical peak 42.7695 cents, on-peak 23.4984 cents, off-peak 10.2875 cents, discount 7.4375 cents per kWh, plus a $14.00 monthly customer charge. On Critical Peak Days, on-peak hours become Critical Peak Hours — Duke may shift them an hour either way, and notice can come as late as one hour before. Miss the text and run the dryer at the wrong hour, and that hour costs roughly three and a half times the 12.26-cent Schedule RS energy rate. Progress rates are similar (critical peak 41.002 cents, on-peak 21.952 cents, off-peak 11.000 cents, discount 8.274 cents — installer-published November 4, 2026 — confirm current DEP rates at duke-energy.com).
The netting rule is the whole game. Under RSC, deliveries and consumption are netted within each TOU pricing period each month — critical peak hours netted as their own period. Midday production mostly lands in the cheaper discount and off-peak periods, and whatever exceeds your consumption in that period earns the 4.53 cent (Carolinas) or 3.94 cent (Progress) excess credit rather than offsetting expensive evening on-peak use. The same $1.01 per kW non-bypassable charge and $22/$28 minimum bill apply, and systems above 15 kW pay a grid access fee of $2.05 per kW per month (Carolinas). PowerPair customers on RSC must stay on RSC for 24 months, then may switch to the Bridge subject to availability; two rider switches are allowed within 10 years.
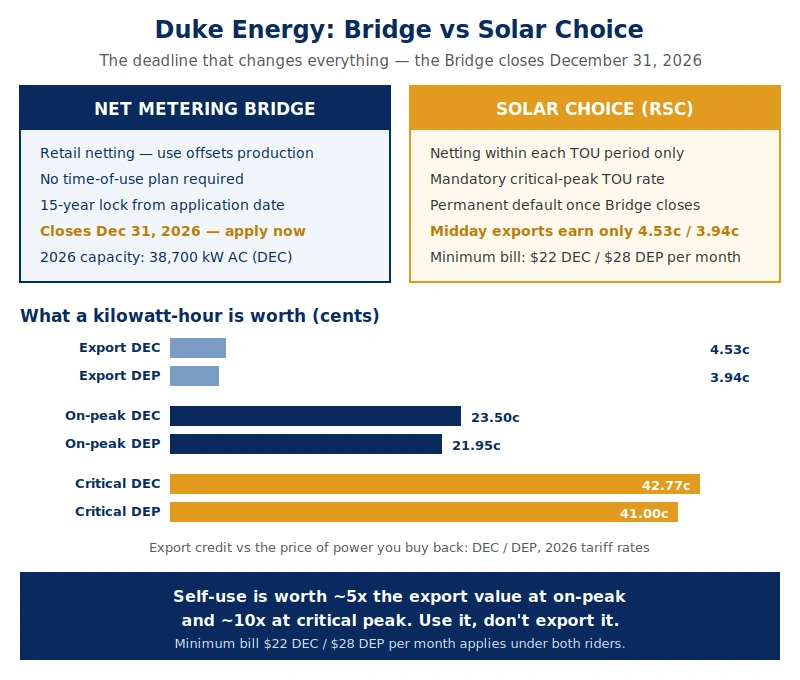
The self-consumption math — the article’s key insight: on Solar Choice, a self-consumed kilowatt-hour offsets 21.95–23.50 cents on-peak (or up to 41–43 cents on a critical-peak hour), while an exported kilowatt-hour earns 3.94–4.53 cents. Self-use is worth about 5 times the export value at on-peak rates and about 10 times at critical peak. Even on the Bridge, month-end leftovers earn only 4.53/3.94 cents. Oversizing a system for export income is a losing design under both Duke riders — the economics reward a right-sized array plus a battery that moves solar into on-peak and critical-peak hours.
Duke Energy Carolinas vs Duke Energy Progress — and everyone else
Duke is two utilities in North Carolina, with different rates, different riders, and different rate cases — and on January 1, 2027, they merge into one. Here is the split that decides your bill.
Duke Energy Carolinas (DEC) covers the western half of the state, including Charlotte, Greensboro, Winston-Salem, and Durham — about 2.6 million customers. Its standard residential rate (Schedule RS, effective January 1, 2026) is a flat 12.2603 cents per kWh before riders, plus a $14.00 monthly customer charge. EIA’s 2024 average for DEC residential customers is 13.94 cents per kWh — the better sanity-check figure, because the 12.2603-cent figure excludes the rider increments stacked on top.
Duke Energy Progress (DEP) covers the eastern half, including Raleigh, Wilmington, and Asheville — about 1.36 million residential customers at an EIA 2024 average of 15.54 cents per kWh, about 15.5 cents in 2026. Progress customers pay more per kilowatt-hour, earn a lower export credit (3.94 vs 4.53 cents), and pay a higher minimum bill ($28 vs $22). Raleigh solar pencils worse than Charlotte solar on every line of the tariff — EnergySage shows Raleigh payback at 14.94 years vs Charlotte’s 13.5.
The merger: Duke filed in August 2025 to merge DEP into DEC (NCUC dockets E-7 Sub 1332 / E-2 Sub 1383). All three approvals are in — FERC on January 30, 2026, the South Carolina commission on April 30, 2026, and the NCUC on May 1, 2026 — with a targeted effective date of January 1, 2027. Nothing changes for customers on that date itself: the two rate sets integrate over time through future rate cases. Do not let a sales pitch use the merger as urgency. The Bridge deadline is the real urgency. Duke also filed for 2027 rate increases in late 2025, still pending at the NCUC — proposals, not approved rates.
Outside Duke territory, the rules change completely — and for some homes, they are better. Dominion Energy North Carolina (northeastern NC) still offers full retail 1:1 net metering on home systems up to 25 kW: credits roll over month to month and true up on May 31, when unused credit is forfeited. The application fee is $200 under 20 kW and $750 above. On Dominion, every kilowatt-hour earns retail credit, so a properly sized system gets full value for its exports. Blue Ridge Energy (western mountains) lets members choose retail-rate net metering up to 25 kW or 5.0 cents per kWh net billing up to 100 kW. Most other co-ops pay 3–4 cents per kWh avoided-cost net billing. Municipal utilities are not NCUC-regulated and set their own terms — check your provider before you sign.
For comparison, California’s NEM 3.0 pays roughly 4–8 cents per exported kilowatt-hour against much higher retail rates, and Texas has no net metering either, with buyback plans at 3–8.5 cents. North Carolina’s split — 3.94 to 4.53 cents on Duke, full retail on Dominion — is wider and more utility-dependent than either. Arizona’s export split (1.87 to 5.554 cents by utility) is the closest parallel.
Do you need a battery in North Carolina in 2026?
In North Carolina, a battery is not a luxury add-on. On Solar Choice, it is the tool that fixes the export problem. Export credits of 3.94–4.53 cents vs on-peak retail of 21.95–23.50 cents (critical peak 41–43 cents) make a stored kilowatt-hour worth about 5 times an exported kilowatt-hour at on-peak, and about 10 times at critical peak. A battery shifts midday surplus to the 6–9 pm on-peak window (DEP summer hours), where it offsets the most expensive power and rides through critical-peak events.
Cost. A 13.5 kWh battery runs about $13,000 installed in North Carolina (ecogenamerica, mid-2026). The national anchor is a Tesla Powerwall 3 (13.5 kWh) at about $15,000 installed with new solar (Solar.com marketplace, September 2026), with a single 10–13.5 kWh system running $10,000–$16,000 (Solar.com / IntegrateSun, 2026). An 8 kW solar system ($19,680) plus one 13.5 kWh battery (~$13,000) is roughly $32,680 gross — or $24,400 net with the full PowerPair rebate, if it is confirmed in writing.
No upfront battery rebate exists apart from PowerPair. Battery value beyond PowerPair comes from Duke’s Battery Control program (called Power Manager in Carolinas territory and EnergyWise Home in Progress territory): $6.50 per kW per month of battery power, adjusted by model. A Tesla Powerwall 3 earns $52 a month — $624 a year; a Powerwall 2 earns $23 a month ($276 a year); a Powerwall+ earns $26 a month ($312 a year). The maximum is $91 a month ($1,092 a year) at the 20 kW interconnection limit. Duke controls the battery for 30–36 events a year; the minimum term is 1 year and the maximum is 10. One restriction: on the Solar Choice path, you cannot join Battery Control for the first 24 months. PowerPair Cohort B pairs the Bridge rate with Battery Control and adds ongoing monthly credits (about $37 a month for a typical 10 kW battery system, per installer-published 8MSolar data, not a Duke tariff figure).
Does a battery pay in North Carolina? On Solar Choice, usually yes — it converts 4-cent exports into 22-cent on-peak self-use and 41-cent critical-peak avoidance, plus $624 a year in Battery Control pay on a Powerwall 3. On the Bridge, the case is moderate — retail netting already protects most export value, so the battery’s job is the month-end leftover, evening-peak coverage, and the $624 a year control credit. On Dominion, the battery case is the weakest in the state — full retail 1:1 net metering means exports already earn retail, so buy a battery for backup power, not for bill savings.
Our solar battery cost guide has the full national battery pricing depth; do not re-derive battery dollars per kWh here.
North Carolina sun, humidity, and hurricanes: what production really looks like
North Carolina’s sun is good — not Arizona good, but comfortably above the national average. The state averages 5.25 peak sun hours a day (NREL PVWatts), against a US average of 4.98. By area: the coast runs about 5.1, Raleigh and Charlotte about 5.0, and the Asheville mountains about 4.4 — a 14% gap between coast and mountains. The planning production yield is 1,390 kWh per installed kW in year one (Home Solar Atlas, August 27, 2026: a 10 kW system produces 13,900 kWh a year). That puts an 8 kW system at about 11,120 kWh a year, a 9.76 kW median system at about 13,570 kWh, and a 14.5 kW EnergySage-average system at about 20,155 kWh.
A typical North Carolina home uses about 1,015 kWh a month — about 12,180 kWh a year (ecogenamerica, October 2026). An 8 kW system therefore covers roughly 90% of annual use. But the annual total is not the story — the timing is. Midday production lands in discount and off-peak periods on Solar Choice, while expensive evening on-peak use (6–9 pm, DEP summer hours) needs a battery or load shifting. Production is strongest in spring (mild and clear) and weakest in winter. Summers are humid with frequent afternoon clouds and thunderstorms, which trim output on the cloudiest afternoons; no North Carolina-specific cloud-loss percentage was verified, so none is given here.
Heat is a smaller story here than in Arizona. North Carolina summers are hot and humid but milder than the desert Southwest — panel temperature derating applies (panels are rated at 25°C cell temperature), but it is not the deciding factor in equipment choice. Hurricanes are the bigger climate story. Coastal counties are Wind Zone III (110–150 mph design winds), and installations there need wind-rated racking and, at 140+ mph, PE-stamped structural plans. Ask a coastal installer how the racking is rated and whether the wind engineering is itemized — and if your roof is older, remember the roof-first rule from the quote section.
Rank locations by utility and rider, not by sun. The sun gap between coast and mountains is about 14%; the export-value gap between Dominion’s retail netting and Duke’s 4-cent credits is about 5 times. Your bill’s return address matters more than your roof’s compass bearing.
HOA rights: what North Carolina law actually says
North Carolina protects solar homeowners — but with a front-facing exception Arizona does not have, so read the fine print.
N.C. Gen. Stat. § 22B-20 (enacted 2007) says any deed restriction, covenant, or similar binding agreement running with the land that would prohibit, or have the effect of prohibiting, a residential solar collector is void and unenforceable. Subsection (c) adds that a restriction does not violate the statute if it does not prevent the reasonable use of a solar collector — location and screening rules are permitted as long as they do not prevent reasonable use.
Subsection (d) — the front-facing exception — is the part most summaries skip. A covenant may prohibit collectors visible by a person on the ground in three listed spots: on the facade facing areas open to common or public access; on a roof surface sloping downward toward those areas; or within the area set off by a line across the facade extending to the property boundaries. But the exception applies only if the covenant expressly lists it. The North Carolina Supreme Court held in Belmont Ass’n, Inc. v. Farwig, 2022-NCSC-64 that broad architectural-review discretion cannot be used to prohibit panels, and a committee could not limit panels to the back of the home where that would prevent reasonable use due to roof orientation.
Two honest gaps: the protection does not apply to multi-story condominium buildings with horizontal unit boundaries, and HOAs may still require an architectural application — submit it, do not skip it. One more caution: some secondary sources describe “5% of price / 10% of output” thresholds for HOA placement rules, apparently from a 2021 House-passed bill. Those thresholds are not in the current § 22B-20 text as verified by the legal summaries we read, so they are not presented here as current law. Unlike Arizona’s §33-1816, North Carolina’s law genuinely does let an HOA bar a street-facing array if the covenants expressly say so. Check your covenants before you buy.
Payback and 25-year savings math
Published benchmarks. EnergySage (November 2026) puts North Carolina payback at 15.74 years for the 14.5 kW average system, with 25-year savings of $31,760. City pages: Charlotte 13.5 years ($41,485), Raleigh 14.94 years ($38,303), Southport 10.9 years ($50,443). High Point is the cautionary outlier: 24.35 years and only $5,178 in 25-year savings on an oversized 18.55 kW system — the clearest published proof that oversizing on a low-value export plan destroys payback. The national cash payback in 2026 is 9–13 years; North Carolina runs longer because power is cheap and export credits are low.
Our range: about 11.8–18 years depending on utility and rider — Dominion (1:1 net metering) at the fast end, the Bridge in the middle, Solar Choice without a battery at the slow end. EnergySage’s 15.74-year statewide figure sits in the middle.
Worked model: 8 kW system, Duke Energy Carolinas, Bridge rider. Every line is shown — this model is ours, not EnergySage’s, and the assumptions are stated below.
| Line | Math | Result |
|---|---|---|
| Gross installed cost | 8,000 W x $2.46/W | $19,680 |
| Less federal credit | $0 (2026 owned install) | $0 |
| Less state credit | None exists in NC | $0 |
| Less PowerPair (solar-only install) | Not available without a battery | $0 |
| Net cost | $19,680 | |
| Annual production | 8 kW x 1,390 kWh/kW/yr | ~11,120 kWh/yr |
| Self-consumed (60%, no battery) | 6,672 kWh x 14.95¢ retail | $997/yr |
| Exported (40%, month-end leftover) | 4,448 kWh x 4.53¢ DEC excess credit | $201/yr |
| Gross year-1 savings | ~$1,198/yr | |
| Less non-bypassable charge | 8 kW x $1.01/kW/mo x 12 | −$97/yr |
| Year-1 savings (net) | ~$1,101/yr | |
| Simple payback (net cost) | $19,680 / $1,101 | ~17.9 years |
| 25-yr gross savings | $1,101/yr escalating ~2.5%/yr (electricity inflation), less ~0.5%/yr panel degradation | ~$35,200 |
| Less inverter replacement (once, ~yr 12–15) | −$2,000 | |
| Less net system cost | −$19,680 | |
| 25-year net savings (modeled) | ~$13,500 |
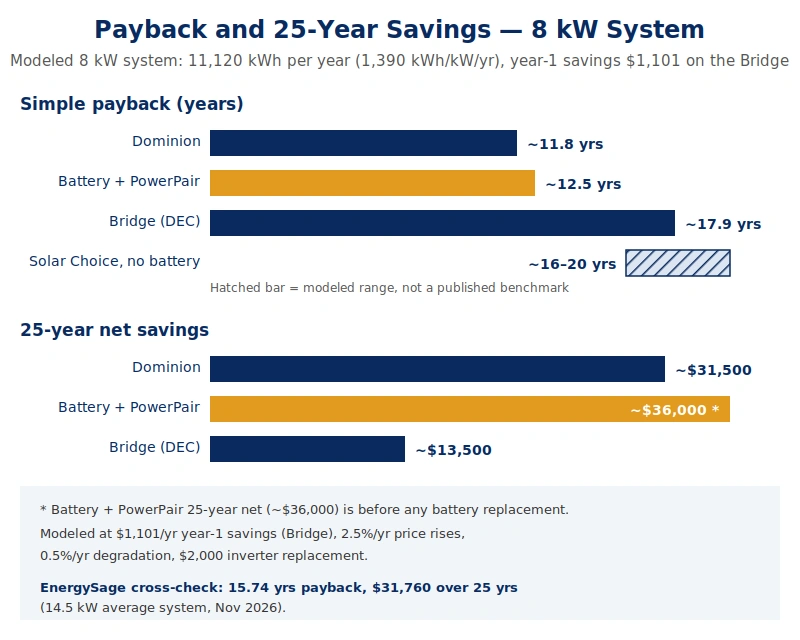
Assumptions, stated plainly: 60% self-consumption without a battery (a battery raises this to ~80%); retail value 14.95 cents/kWh (EIA statewide average, August 2026); DEC excess credit 4.53 cents; 2.5%/yr electricity-price escalation; 0.5%/yr degradation; one inverter replacement ~$2,000; Bridge retail netting assumed (self-consumed kWh at retail, only month-end leftovers at 4.53 cents — on Solar Choice the split is per-TOU-period, so the same system earns less without a battery). EnergySage’s $31,760 is for a larger 14.5 kW system with different assumptions. The Bridge model is intentionally conservative: it prices self-use at the statewide average rather than the higher on-peak TOU rates a load-shifting household can capture.
Same 8 kW system, other utilities (modeled, same assumptions): on Dominion, year-1 savings are ~11,120 kWh x 14.95 cents = ~$1,662/yr, payback ~11.8 years, 25-year net ~$31,500 (no non-bypassable charge was verified for Dominion, so none is included here). On Solar Choice without a battery (DEC or DEP), no single point figure is given — per-TOU-period netting means midday exports earn 4.53/3.94 cents while evening use bills at 21.95–23.50 cents. The modeled range is ~$950–$1,200 a year in year 1, payback ~16–21 years — a modeled range, not a published benchmark. A battery is what closes the gap.
With a battery + PowerPair (DEC, Bridge): 8 kW + 13.5 kWh battery = $32,680 gross − $8,280 PowerPair = $24,400 net; self-consumption ~80% gives $1,330 self-use + $101 exports − $97 non-bypassable + $624 a year Battery Control (Powerwall 3) = ~$1,958 a year, payback ~12.5 years, 25-year net ~$36,000. That 25-year figure excludes a likely battery replacement within 25 years — budget for one separately. Without PowerPair, the same system costs $32,680 net and pays back in ~16.7 years.
Annual savings for a typical 8 kW system: Bridge (DEC), no battery, ~$1,101 a year. Dominion, ~$1,662 a year. Solar Choice, no battery, ~$950–$1,200 a year (modeled range). Bridge + battery + PowerPair, ~$1,958 a year (including $624 a year in Battery Control credits). An 8 kW system covers about 90% of typical annual use (~11,120 kWh produced vs ~12,180 kWh used) — leaving a small residual, because fixed charges ($14 a month customer charge; $22 a month Bridge minimum bill) survive any system size.
North Carolina’s scale, for context: 10,127 MW installed (September 2026, SEIA/Wood Mackenzie), ranking 5th nationally, with 400 MW added in 2025 and 7,500 solar jobs (SEIA, June 2026). The state is a solar giant at utility scale — and a rooftop market where the fine print decides everything.
How to get quotes in North Carolina + red flags
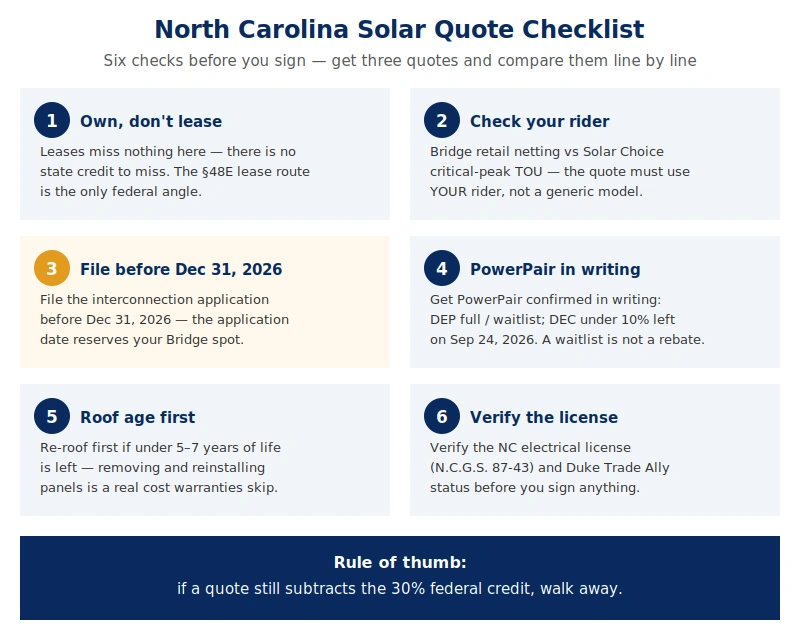
Get three or more installer quotes, and use the same question list every time so the answers compare:
- What’s my $/W before any incentives? The North Carolina benchmark is $2.46–$2.76/W. Anything above $3.50/W needs a justification (premium equipment, complex coastal wind engineering, difficult permitting).
- Does the quote subtract the 30% federal credit? If yes, it is using dead law. Ask them to remove it — that is $5,904 on a $19,680 system.
- Which rider will I be on — Bridge or Solar Choice — and is the savings model built for that rider? If the model uses retail value for all production, it ignores the 3.94–4.53 cent export reality and the per-TOU-period netting on Solar Choice. Ask for self-consumption and export shown as separate lines, on YOUR rider.
- Has my interconnection application been filed — and before December 31, 2026? The Bridge spot is reserved on the application date. If the installer has not filed, you may land on Solar Choice regardless of what the quote assumes.
- Is PowerPair money confirmed in writing by Duke? DEP is full and waitlist-only; DEC had less than 5% left on November 2, 2026. A waitlist spot is not a rebate.
- Is it a lease or a loan? If a lease, ask how the §48E value flows to you — the lessor claims the credit, and the discount should show in the monthly payment. If anyone offers a per-kWh PPA, walk away: PPAs are effectively barred in North Carolina.
- What’s the installer’s NC electrical contractor license number, and is it a Duke Trade Ally? The license is required by law (N.C.G.S. 87-43); Trade Ally status is required for PowerPair.
Red flags from real North Carolina patterns. “Free solar” and “government program” claims: no North Carolina program installs panels for free — EnergizeNC (Solar for All) never opened to households (checked October 5, 2026). Zero-down means a loan or a lease, not $0 overall. The Bridge-vs-Solar-Choice confusion is the #1 North Carolina-specific trap: quotes that assume Bridge terms (retail netting, no TOU) for a customer who will actually land on Solar Choice after December 31, 2026. And the oldest trap of all: savings modeled at retail for every kilowatt-hour, which ignores the 4-cent export reality entirely. Door-to-door sales carry a 3-day right to cancel under the FTC Cooling-Off Rule (16 CFR Part 429) for sales of $25 or more.
Where to complain: the North Carolina Utilities Commission (utility and rider disputes); the NC Licensing Board for General Contractors and the NC State Board of Examiners of Electrical Contractors (license and complaint checks); the NC Attorney General’s consumer protection division (deceptive sales practices). Verify the license yourself — do not take the installer’s word for it.
Sources & methodology
Cost anchors: EnergySage North Carolina state page (November 2026: $2.46/W, 14.5 kW average system, $35,592, range $30,253–$40,931; 5 kW $12,276; Charlotte $2.36/W, Raleigh $2.53/W); Home Solar Atlas (August 27, 2026: $2.43/W, citing EnergySage marketplace; 1,390 kWh/kW/yr); OhmSnap (October 5, 2026: $2.44/W, typical quotes $2.30–$2.87/W); Ecogenamerica Solar Cost Index (September 2026 edition: $2.76/W, 9.76 kW median installed system $26,938; Berkeley Lab median 9.76 kW, 2025, 5,650 systems); EnergySage Marketplace Report 23rd edition (September 2026: national median $2.62/W solar-only). Size table calculated from the $2.46/W anchor at the $2.76/W high end.
Electricity rates: EIA Electric Power Monthly Table 5.6.A (August 2026, released October 28, 2026: North Carolina residential 14.95¢/kWh, US 18.16¢/kWh, NC 14th lowest of 51; avg bill $195.84 in August at 1,310 kWh); EIA 2024 utility data via Solar Learning Lab (DEC 13.94¢/kWh avg; DEP 15.54¢/kWh avg); DEC Schedule RS (12.2603¢/kWh + $14.00/mo, eff. January 1, 2026).
Export rates and riders: Solar Learning Lab “Duke Energy Carolinas solar in 2026” (August 28, 2026, reading the Duke tariff leaves directly): Rider RSC Leaf No. 141 eff. July 1, 2026 (4.53¢ excess credit; $1.01/kW/mo non-bypassable; $22/mo minimum bill; $2.05/kW/mo grid access above 15 kW; 20 kW AC cap); Rider NMB Leaf No. 143 eff. July 1, 2026 (closes January 1, 2027; 2026 capacity 38,700 kW AC; up to 15 years; no TOU requirement); Schedule RSTC Leaf No. 136 eff. January 1, 2026 (critical peak 42.7695¢, on-peak 23.4984¢, off-peak 10.2875¢, discount 7.4375¢). DEP figures: ecogenamerica (October 2026: 3.94¢ excess credit; $28/mo minimum bill); now.solar/WilmingtonBiz (November 4, 2026: DEP critical peak 41.002¢, on-peak 21.952¢, off-peak 11.000¢, discount 8.274¢). EnergySage NC incentives page (January 6, 2026: net metering closed September 30, 2023; RSC/NMB choice). Dominion/Blue Ridge/co-op terms: ecogenamerica (October 2026: Dominion 1:1 to 25 kW, May 31 true-up, $200/$750 fees; Blue Ridge retail to 25 kW or 5.0¢ to 100 kW; most co-ops 3–4¢).
Incentives: Duke PowerPair page via Solar Learning Lab (August 28, 2026: $0.36/W-AC to 10 kW-AC, $400/kWh to 13.5 kWh, $9,000 max, Trade Ally required, apply within 90 days of operation); ecogenamerica (September 29–October 1, 2026: DEP full/waitlist, DEC less than 10% of 30,000 kW left September 24, 2026, Solar Choice path only); DSIRE (programs.dsireusa.org, NC State University) — verify all NC items there at publish time; G.S. 105-275(45) (property-tax exclusion, 80% of appraised value; Form AV-10 by January 31); EnergySage (January 6, 2026: no NC sales-tax exemption; NC state credit expired December 31, 2015); OBBBA P.L. 119-21 (signed July 4, 2025), IRS FS-2025-05 (August 21, 2025, FAQ 7). HEAR: NC DEQ Energy Saver NC; heatpumppricing.com (verified November 4, 2026); gridshiftmedia (October 21, 2026) — open all 100 counties; up to $8,000 heat pump / $4,000 panel / $2,500 wiring (DEQ lists both $2,500 and $2,000); no fuel-switching since September 1, 2026 (DOE Program Notice 26-2, May 29, 2026). EnergizeNC/Solar for All never opened to households (ecogenamerica, checked October 5, 2026). SREC value effectively $0 for homeowners (powerdonebetter, August 2026).
Production: Home Solar Atlas (August 27, 2026: 1,390 kWh/kW/yr planning yield; 10 kW produces 13,900 kWh/yr); NREL PVWatts via ecogenamerica (October 2026: 5.25 peak sun hours/day; coast 5.1, mountains 4.4); typical NC home usage ~1,015 kWh/month (~12,180 kWh/yr) (ecogenamerica, October 2026). Coastal wind: ASCE 7-16 Wind Zone III, 110–150 mph (ecogenamerica, October 2026).
Battery: Ecogenamerica NC (mid-2026: 13.5 kWh battery ~$13,000 installed); Powerwall 3 (13.5 kWh) ~$15,000 installed with new solar (Solar.com, September 2026 — national anchor); single 10–13.5 kWh system $10,000–$16,000 (Solar.com / IntegrateSun, 2026); Battery Control $6.50/kW/mo, Powerwall 3 $52/mo = $624/yr, 30–36 events/yr (Tesla Duke VPP page; Generac; Southern Energy, October 2026); PowerPair Cohort B ~$37/mo (8MSolar, 2026 — installer-published). SolarEdge cites up to $275/yr for Bridge-enrolled participants — a different program slice.
HOA: N.C. Gen. Stat. § 22B-20 (2007); Belmont Ass’n, Inc. v. Farwig, 2022-NCSC-64 (NC Supreme Court, 2022) — see pv-magazine USA; legal500.com (2026); apmhoa.com (2026). The 5%/10% threshold claims describe a 2021 House-passed bill, not the current statute text.
Payback model: EnergySage North Carolina state page (November 2026: 15.74-year payback, $31,760 25-year savings, 14.5 kW system; Charlotte 13.5, Raleigh 14.94, Southport 10.9, High Point 24.35 years). The 8 kW worked model is our arithmetic with stated assumptions (60% self-consumption, 14.95¢ retail value, 4.53¢ DEC excess credit, $1.01/kW/mo non-bypassable, 2.5%/yr escalation, 0.5%/yr degradation, $2,000 inverter replacement). SolarReviews’ 8.5-year payback figure (November 2026) appears to predate the 2026 credit loss and is not used.
State scale: SEIA/Wood Mackenzie (September 2026: 10,127 MW installed, ranks 5th, 400 MW added in 2025, $671M invested in 2025) — see SEIA North Carolina fact sheet (June 2026: 7,500 solar jobs).
EXCLUDED: the ~3.4¢ blended Duke export figure (powerdonebetter, August 2026 — a rounded avoided-cost estimate, not a tariff figure); any “after 30% credit” net prices (SolarInstallGuide, 2026); the greensavehome claim of 0% NC sales tax on solar (contradicted by EnergySage + DSIRE-based sources); “100% property-tax exempt” claims (the statute excludes 80%); the 5%/10% HOA thresholds as current law (2021 bill language, not § 22B-20); the claim that NMB requires EnergyWise battery enrollment (powerdonebetter — not in the tariff-leaf summary); the SolarReviews 8.5-year payback as a headline; the DEP ~$23/month 2027 increase proposal as fact (pending rate case only); any North Carolina-specific panel-upgrade cost figure (unverified — national $2,500–$4,500 range used, flagged); any NC-specific soiling/cloud-loss percentage (unverified — no figure invented).
*Disclaimer: Prices are 2026 North Carolina planning figures and change by utility territory, rider, roof, and installer. Always get 3 written local quotes before budgeting. Tax information is general, not tax advice — confirm with a tax professional. Export rates and rider rules reset on utility calendars — the Net Metering Bridge closes to new applicants on January 1, 2027, and PowerPair capacity was nearly exhausted on September 24, 2026 — verify the current rider, export credit, and rebate availability with Duke Energy in writing before signing.*
—
How much do solar panels cost in North Carolina in 2026?
Solar panels cost $2.46–$2.76 per watt installed in North Carolina in 2026 (EnergySage, November 2026; EcoGen Solar Cost Index, September 2026). An 8 kW system runs about $19,680 gross — and $19,680 net, since there is no federal credit and no state credit to subtract. The North Carolina-average 14.5 kW system costs $35,592.
Is there still a federal solar tax credit in North Carolina in 2026?
No — $0 for homeowner-owned systems. The §25D residential credit ended for installations completed after December 31, 2025 (OBBBA, P.L. 119-21; IRS FS-2025-05). North Carolina has no state solar tax credit either — it expired in 2015 and was never reinstated. Leased systems may still benefit from the §48E credit through December 31, 2027.
Does North Carolina have net metering?
Not for new Duke Energy customers — full-retail net metering ended October 1, 2023. New Duke customers get net billing: the Net Metering Bridge offers retail netting but closes to new applicants on December 31, 2026, and Solar Choice pays 4.53 cents (Carolinas) or 3.94 cents (Progress) per exported kilowatt-hour. Dominion Energy North Carolina still offers full retail 1:1 net metering up to 25 kW.
What is the Duke Energy solar export rate in 2026?
4.53 cents per kilowatt-hour in Duke Energy Carolinas territory and 3.94 cents in Duke Energy Progress territory, for month-end or per-TOU-period excess energy under both the Bridge and Solar Choice riders (Duke tariff leaves, effective July 1, 2026). That is about a third (Carolinas) to a quarter (Progress) of the retail rate.
What is Duke PowerPair and is it still available?
PowerPair pays up to $9,000 — $0.36 per watt of solar up to 10 kW ($3,600) plus $400 per kWh of battery up to 13.5 kWh ($5,400) — for solar and battery installed together through a Duke Trade Ally. As of November 2, 2026, Duke Energy Progress was full and waitlist-only, and Duke Energy Carolinas had less than 5% of its capacity left. Get written confirmation from Duke before counting on it.
Can my HOA stop me from installing solar panels in North Carolina?
No outright ban — N.C. Gen. Stat. § 22B-20 makes deed restrictions that prohibit, or effectively prohibit, residential solar void and unenforceable, and the NC Supreme Court confirmed this in Belmont v. Farwig (2022). The one real exception: a covenant may bar collectors visible from the ground on the street-facing facade or roof slope, but only if the covenant expressly lists it. The protection does not apply to multi-story condominiums.
Do I need a battery with solar panels in North Carolina?
Strongly recommended on Duke’s Solar Choice rider, where exports earn 3.94–4.53 cents while on-peak power costs 21.95–23.50 cents (critical peak 41–43 cents). A 13.5 kWh battery runs about $13,000 installed in North Carolina, and Duke’s Battery Control program pays $52 a month ($624 a year) for a Tesla Powerwall 3. On Dominion’s 1:1 net metering, a battery is for backup power, not bill savings.
How long until solar pays for itself in North Carolina in 2026?
About 11.8–18 years depending on utility and rider. Our modeled 8 kW system pays back in about 11.8 years on Dominion, about 12.5 years with a battery and PowerPair, and about 17.9 years on the Duke Bridge. EnergySage’s statewide figure is 15.74 years for the average 14.5 kW system, with $31,760 in 25-year savings.