

Table of Contents
The same home project can cost $12,000 more in one state than another. Not because the equipment changes — a 3-ton heat pump is a 3-ton heat pump — but because labor rates, building codes, climate, permitting, and installer competition all move with the state line.
This index ranks all 50 states on one number so you can see where your state sits before you get quotes. It is built from published 2026 data, not from a survey we ran: heat pump pricing by state (NumeralQ, October 2026), solar $/W by state (EnergySage marketplace data, September 2026), and a roofing cost index by state (SmartRoofingCalculator, October 2026). Every input is named in the methodology section, including the two places we adjusted the math and why.
One warning up front: an index is a planning tool, not a quote. Your roof pitch, your panel brand, and your contractor’s backlog all move the real number. Use the rank to set expectations, then get three written quotes.
How the index works
The NestPriced Home Project Cost Index sets the US average at 100. A state at 115 costs about 15% more than the national average across the three services; a state at 89 costs about 11% less.
The formula: 40% roof index + 30% heat pump index + 30% solar index. Each component is the state’s figure divided by the national figure, times 100.
The three national anchors, all 2026:
| Service | National figure (2026) | Source |
|---|---|---|
| Heat pump, 3-ton ducted air-source, installed | $6,550–$10,960 (midpoint $8,755) | NumeralQ, Oct 26, 2026 |
| Solar, installed $/W | $2.60/W (8 kW = $20,960) | EnergySage marketplace, Sep 2026 |
| Roof, architectural asphalt, installed | $450–$650 per square (25-square roof $11,250–$16,250) | SmartRoofingCalculator, Oct 11, 2026 |
Why these weights? Roofing carries the most weight because it is the biggest single job and the series with the most complete state methodology (labor + goods, BLS wages + BEA price parities). Heat pumps and solar split the rest evenly.
One adjustment, disclosed here and in the methodology: solar $/W is capped at $3.50/W inside the index only. Five states exceed it — North Dakota ($4.23), Alabama ($3.85), Nebraska ($3.60), Tennessee ($3.53), and Wyoming ($3.51). Those figures come from very thin installer markets with few competing quotes, not from general cost levels. Uncapped, North Dakota would rank #1 on a data artifact. The published $/W is still shown uncapped in the table below; only the composite uses the cap.
What the index does not include: electrical panels and water heaters, because no publisher releases those two jobs state by state. Both get their own section below, with national anchors and index-scaled modeled ranges, labeled as modeled.
The 50-state home project cost index 2026
Rank 1 = most expensive. Heat pump = 3-ton ducted air-source installed (NumeralQ, Oct 2026). Solar = installed $/W (EnergySage via ConsumerAffairs, Sep 2026). Roof = architectural asphalt $/square installed (SmartRoofingCalculator, Oct 2026). * = solar $/W winsorized at $3.50 in the index (thin-market figure; published value shown).
| Rank | State | Index | Heat pump | Solar $/W | Roof $/sq | Key driver |
|---|---|---|---|---|---|---|
| 1 | Minnesota | 115 | $7,120–$11,700 | $3.22 | $510–$730 | Highest roofer wages ($34.90/hr) + cold climate |
| 2 | Hawaii | 113 | $6,720–$11,180 | $3.43 | $490–$700 | Island shipping + costly solar |
| 3 | Alaska | 113 | $7,160–$11,750 | $3.14 | $500–$720 | Remote logistics + heating demand |
| 4 | Illinois | 112 | $7,160–$11,750 | $2.98 | $510–$740 | Chicago metro labor |
| 5 | North Dakota | 110* | $7,050–$11,610 | $4.23* | $430–$620 | Thin solar market (capped in index) |
| 6 | Massachusetts | 110 | $7,150–$11,740 | $2.91 | $500–$720 | High wages + cold-climate systems |
| 7 | New York | 110 | $7,050–$11,600 | $2.76 | $520–$750 | NYC metro labor + strict code |
| 8 | New Jersey | 108 | $7,050–$11,610 | $2.59 | $520–$760 | Highest roof index (116) |
| 9 | Connecticut | 107 | $7,130–$11,710 | $2.67 | $490–$710 | High trade wages |
| 10 | California | 106 | $6,980–$11,520 | $2.52 | $510–$730 | Labor + Title 24/fire code |
| 11 | Washington | 106 | $7,090–$11,660 | $2.54 | $500–$720 | High electrician wages |
| 12 | South Dakota | 106 | $6,570–$10,980 | $3.46 | $400–$580 | Thin solar market |
| 13 | Nebraska | 105* | $6,510–$10,910 | $3.60* | $400–$570 | Thin solar market (capped) |
| 14 | Tennessee | 105* | $6,350–$10,700 | $3.53* | $400–$580 | Thin solar market (capped) |
| 15 | Alabama | 105* | $6,090–$10,360 | $3.85* | $410–$590 | Priciest solar in the US (capped) |
| 16 | Iowa | 105 | $6,540–$10,950 | $3.28 | $410–$600 | Costly solar + cold climate |
| 17 | Wyoming | 104* | $6,320–$10,660 | $3.51* | $390–$560 | Thin solar market (capped) |
| 18 | Michigan | 104 | $6,550–$10,960 | $2.91 | $450–$650 | Cold climate + $2.91/W solar |
| 19 | Wisconsin | 103 | $6,580–$11,000 | $3.06 | $430–$620 | Cold climate + $3.06/W solar |
| 20 | Rhode Island | 103 | $6,790–$11,270 | $2.77 | $450–$660 | Small-state labor costs |
| 21 | New Hampshire | 103 | $7,030–$11,580 | $2.88 | $430–$620 | High wages + cold climate |
| 22 | Maryland | 103 | $6,890–$11,390 | $2.60 | $470–$670 | DC-metro labor |
| 23 | Maine | 102 | $6,630–$11,070 | $2.94 | $430–$620 | Cold climate + $2.94/W solar |
| 24 | Idaho | 101 | $6,380–$10,740 | $3.02 | $420–$600 | Costly solar + remote sites |
| 25 | Colorado | 101 | $6,710–$11,160 | $2.66 | $450–$650 | Hail belt + Denver labor |
| 26 | Oregon | 101 | $6,620–$11,060 | $2.46 | $470–$680 | Highest electrician wages, offset by cheap solar |
| 27 | Indiana | 100 | $6,530–$10,940 | $2.75 | $440–$630 | Near the national average |
| 28 | Vermont | 100 | $6,600–$11,020 | $2.75 | $430–$630 | Cold climate |
| 29 | Ohio | 100 | $6,610–$11,040 | $2.61 | $440–$640 | Near the national average |
| 30 | Pennsylvania | 99 | $6,610–$11,030 | $2.58 | $440–$640 | Near the national average |
| 31 | Delaware | 99 | $6,600–$11,030 | $2.64 | $430–$620 | Near the national average |
| 32 | Missouri | 99 | $6,510–$10,910 | $2.50 | $450–$650 | Near the national average |
| 33 | Kansas | 98 | $6,530–$10,940 | $2.63 | $420–$610 | Low labor, average solar |
| 34 | Virginia | 97 | $6,510–$10,900 | $2.54 | $430–$620 | N. Virginia labor vs. rest of state |
| 35 | Nevada | 97 | $6,540–$10,940 | $2.42 | $440–$630 | Cheap solar offsets Vegas labor |
| 36 | South Carolina | 97 | $6,390–$10,750 | $2.60 | $420–$600 | Low wages, average solar |
| 37 | Montana | 96 | $6,550–$10,960 | $2.47 | $430–$620 | Low wages + cheap solar |
| 38 | West Virginia | 96 | $6,110–$10,380 | $2.90 | $390–$560 | Lowest wages, costly solar |
| 39 | Kentucky | 96 | $6,470–$10,850 | $2.54 | $410–$600 | Low wages |
| 40 | Utah | 95 | $6,470–$10,860 | $2.39 | $430–$620 | Cheap solar |
| 41 | Oklahoma | 95 | $6,430–$10,800 | $2.61 | $400–$580 | Low wages + hail demand |
| 42 | Georgia | 95 | $6,380–$10,740 | $2.50 | $410–$600 | Low wages |
| 43 | North Carolina | 95 | $6,420–$10,780 | $2.43 | $420–$600 | Low wages + cheap solar |
| 44 | Arizona | 94 | $6,490–$10,890 | $2.28 | $420–$610 | Competitive solar market |
| 45 | New Mexico | 93 | $6,160–$10,450 | $2.57 | $390–$560 | Lowest roofer wages ($20.36/hr) |
| 46 | Louisiana | 92 | $6,470–$10,850 | $2.34 | $400–$580 | Low wages + cheap solar |
| 47 | Texas | 92 | $6,430–$10,810 | $2.25 | $410–$590 | Competitive markets + cheap solar |
| 48 | Florida | 91 | $6,390–$10,760 | $2.12 | $410–$600 | Cheapest solar; hurricane code NOT in model |
| 49 | Arkansas | 90 | $6,080–$10,350 | $2.38 | $390–$560 | Lowest electrician wages ($25.71/hr) |
| 50 | Mississippi | 89 | $6,100–$10,380 | $2.29 | $390–$570 | Lowest overall: low wages + cheap solar |
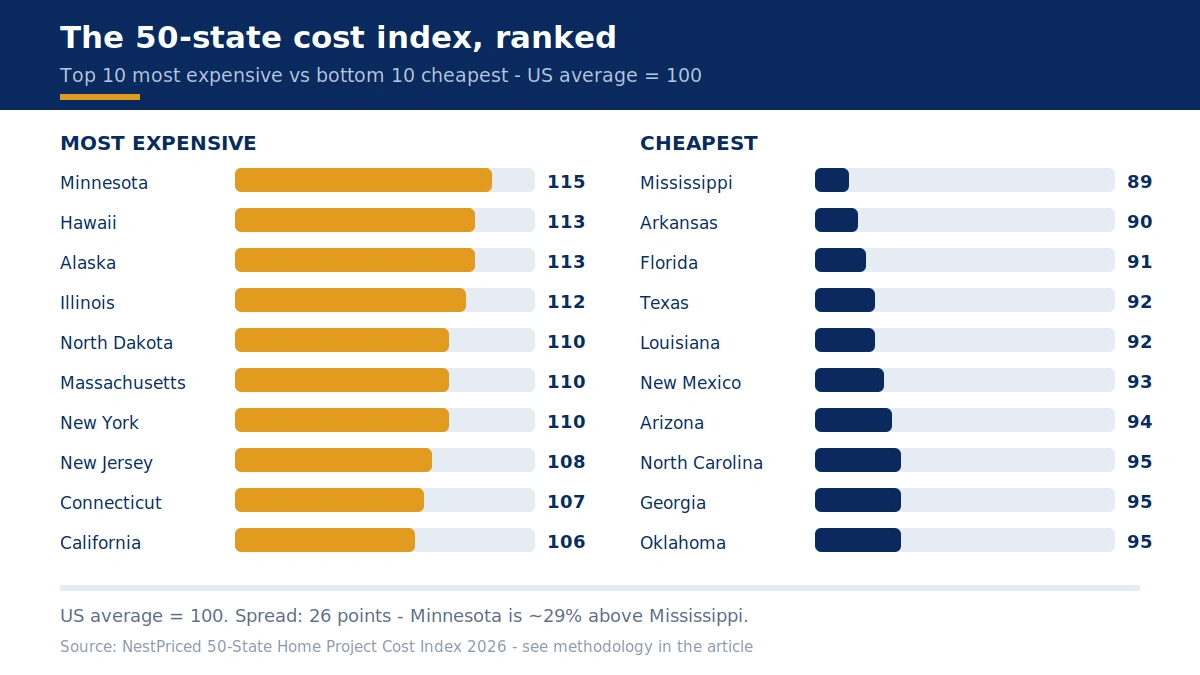
Three patterns jump out. First, the Northeast and upper Midwest dominate the top: six of the top ten are Minnesota, Illinois, Massachusetts, New York, New Jersey, and Connecticut. Second, cheap solar rescues expensive-labor states — California would rank higher if its solar were not $2.52/W, and Oregon’s index (101) is held down by $2.46/W solar despite having the highest electrician wages in the country. Third, the bottom of the table is the South and Southeast, where low trade wages and competitive solar markets stack in the homeowner’s favor.
The 5 most expensive states in 2026
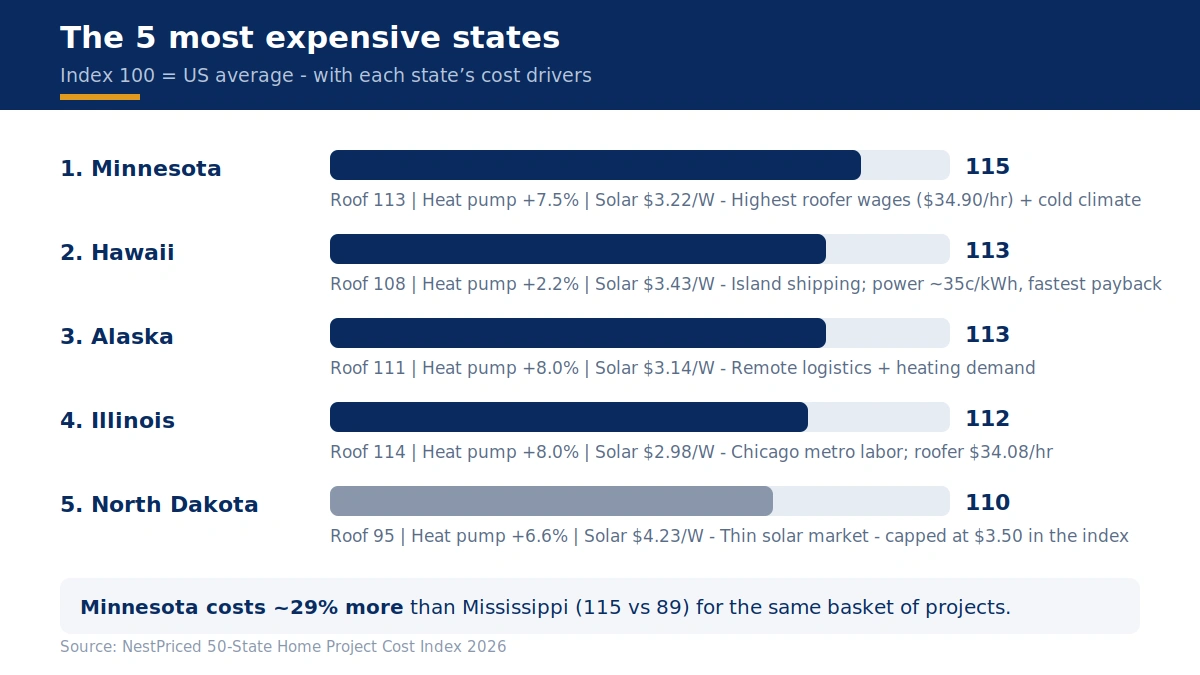
1. Minnesota — index 115. The most expensive state on every component at once: the highest roofer wages in the US ($34.90/hr, BLS OEWS May 2024), heat pumps 7–8% above national, and solar at $3.22/W, ninth-priciest in the country. Cold climate adds cost twice: homes need cold-climate heat pumps (3-ton cold-climate systems run $8,610–$15,040 nationally vs $6,550–$10,960 for standard), and roofs carry snow-load and ice-and-water-shield requirements.
2. Hawaii — index 113. Shipping is the story. Nearly everything arrives by boat, and solar — usually the cheap part of a Hawaii project — is $3.43/W, seventh-priciest in the US. The offset is real: at roughly 35 cents/kWh, Hawaii has the fastest solar payback in the country (about 2.7 years, ConsumerAffairs 2026). Expensive to build, fast to pay back.
3. Alaska — index 113. Remote logistics plus heating demand. Heat pumps tie Illinois for the priciest in the nation ($7,160–$11,750), and the roof index (111) reflects freight and short building seasons. Solar at $3.14/W is high, but with long summer days and high electricity rates it is not the worst value in the table.
4. Illinois — index 112. Chicago drives it: roofer wages of $34.08/hr (fifth-highest nationally) and the second-highest roof index (114). Heat pumps tie Alaska at the top ($7,160–$11,750). Solar at $2.98/W is above average but not extreme — Illinois Shines incentives (2026-27 program year) help on the solar side.
5. North Dakota — index 110. The asterisk state. Its roof (95) and heat pump (106.6) components are ordinary; the rank comes entirely from solar at $4.23/W — the highest published figure in the US, from a market with very few installers and very few quotes. We capped solar at $3.50/W in the composite so one thin-market number could not put North Dakota at #1, and we flag it here rather than hiding it. If you live in North Dakota, get quotes from out-of-state regional installers too — the published average may not be your price.
Just behind: Massachusetts (110) and New York (110), both high-wage, cold-climate, strict-code states, then New Jersey (108) — which has the single most expensive roof market in America (index 116, $520–$760/sq).
The 5 cheapest states in 2026
50. Mississippi — index 89. The cheapest state overall: roofer wages near the bottom ($20.97/hr), heat pumps 6% below national ($6,100–$10,380), and solar at $2.29/W. Low wages and a competitive solar market do all the work.
49. Arkansas — index 90. The cheapest heat pump market in the US ($6,080–$10,350) and the lowest electrician wages in the country (mean $25.71/hr, BLS OEWS May 2025). Roof index 86 ties for cheapest. Solar at $2.38/W is below average.
48. Florida — index 91. The cheapest solar in America ($2.12/W) and low trade wages pull Florida near the bottom — but read the Florida section before celebrating. The roof model behind this index does not price hurricane code, and real Florida roof jobs run well above the modeled figure.
47. Texas — index 92. Competitive installer markets in every metro plus $2.25/W solar, the second-cheapest in the US. Heat pumps run 2% below national ($6,430–$10,810). The catch is on the solar revenue side, not the install side: Texas has no net metering, so the buyback plan matters as much as the panels. Our deep dives: heat pump cost in Texas and solar panel cost in Texas.
46. Louisiana — index 92. Low wages, cheap solar ($2.34/W), and a roof index of 89. Hurricane and flood exposure push insurance costs, but the install prices themselves are among the lowest in the country.
The gap in dollars: the same bundle — a 3-ton heat pump, a 25-square asphalt roof, and an 8 kW solar system — costs $50,720 in Minnesota vs $38,610 in Mississippi, a $12,110 difference (Minnesota 31% more). Nationally the same bundle is $43,305. The full math is in the methodology section.
Heat pump cost by state
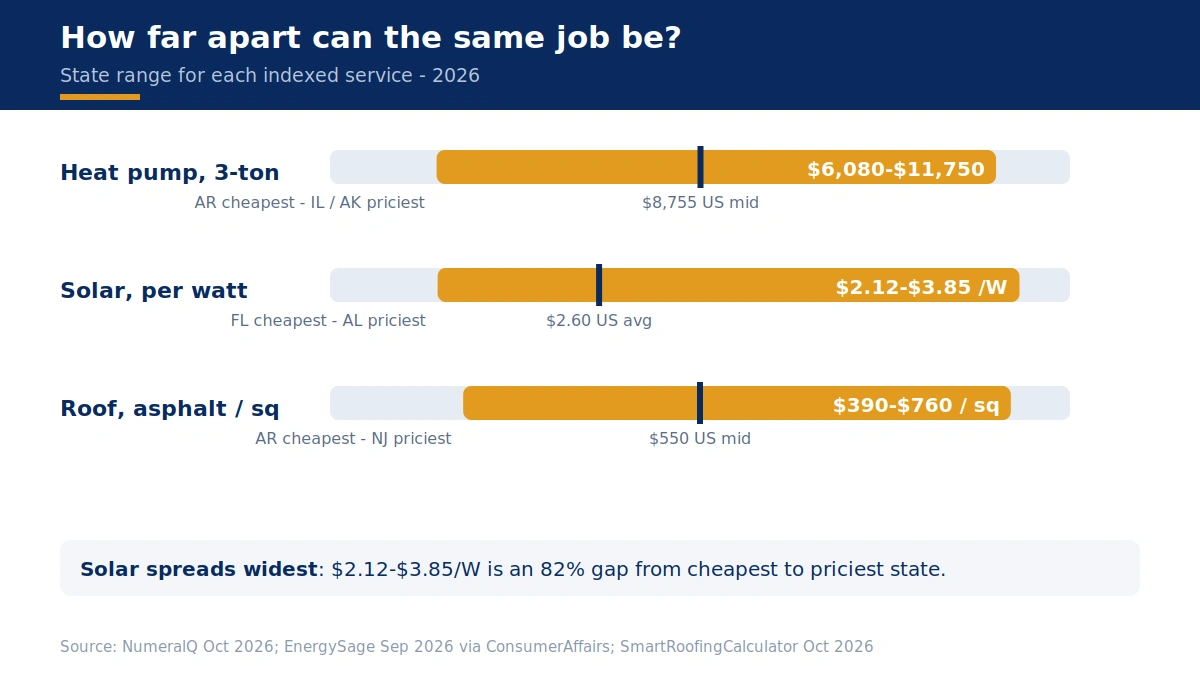
Nationally, a 3-ton ducted air-source heat pump runs $6,550–$10,960 installed (NumeralQ, Oct 2026), midpoint $8,755. State figures move only about 15% from cheapest to priciest — the narrowest spread of the three indexed services. Arkansas is cheapest ($6,080–$10,350, midpoint $8,215); Illinois and Alaska are priciest ($7,160–$11,750, midpoint $9,455).
| Cheapest states | Most expensive states | |
|---|---|---|
| 3-ton heat pump | Arkansas $6,080–$10,350; Mississippi $6,100–$10,380; West Virginia $6,110–$10,380 | Illinois / Alaska $7,160–$11,750; Connecticut $7,130–$11,710; Massachusetts $7,150–$11,740 |
| Why | Low HVAC wages, mild winters, standard equipment | High wages, cold-climate equipment, short seasons |
Two things matter more than the state line. First, system type: a cold-climate ducted 3-ton runs $8,610–$15,040 nationally, and a ductless single-zone runs $3,150–$4,910 — the equipment choice swings the price more than the state does. Second, rebates: HEAR rebates worth up to $8,000 for income-qualified households are the biggest remaining incentive in 2026, but which states are open changes month to month (and a May 2026 DOE notice removed the fuel-switching allowance). Check your state energy office before counting on one. The federal credit is $0 in 2026 — §25C ended for property placed in service after December 31, 2025.
State deep dives: heat pump cost in Texas 2026 ($5,500–$15,000 installed; Austin averages $7,057) and heat pump cost in Florida 2026. National pricing: heat pump cost 2026 and HVAC replacement cost 2026.
Solar panel cost per watt by state
Solar has the widest state spread in the index: $2.12/W in Florida to $3.85/W in Alabama — an 82% gap. The national average is $2.60/W (EnergySage marketplace, September 2026), which puts an 8 kW system at $20,960 before incentives.
| Cheapest $/W | Most expensive $/W | |
|---|---|---|
| States | Florida $2.12; Texas $2.25; Arizona $2.28; Mississippi $2.29; Louisiana $2.33 | North Dakota $4.23*; Alabama $3.85; Nebraska $3.60*; Tennessee $3.53*; South Dakota $3.46 |
| What drives it | Dense installer competition, simple permitting, high volume | Few installers, thin quote volume, low market maturity |
*North Dakota and Nebraska figures reflect very thin markets (see methodology).
The gap is about market maturity, not sunshine. Alabama gets more sun than Massachusetts, yet Alabama solar costs $3.85/W against Massachusetts at $2.91/W — Massachusetts has a deep installer bench and the SMART incentive program; Alabama has few competing installers. Florida pairs the cheapest solar in America with full retail net metering, which is why its payback (about 9 years) beats states with cheaper power but pricier installs. Hawaii is the extreme case the other way: $3.43/W installs, but roughly 35 cents/kWh power, so payback is about 2.7 years — the fastest in the country. Washington is the opposite: cheap-ish installs ($2.54/W) but low power prices and weak sun, so payback stretches to about 17 years (ConsumerAffairs 2026).
The 2026 rule that changes every quote: the 30% federal credit for homeowner-owned solar (§25D) ended for systems completed after December 31, 2025. The price you are quoted now is the real price. Leasing or a PPA is different — the provider’s commercial credit (§48E) survives through December 31, 2027, and is priced into the monthly payment. Ask any lease provider in writing whether the credit was preserved for your install date.
State deep dives: solar panel cost in California 2026 ($2.52/W average; NEM 3.0 export math) and solar panel cost in Texas 2026 ($2.25–$2.85/W; no net metering). National pricing: solar panel cost 2026.
Roof replacement cost by state
Roofing has the widest spread of any single job in the index once you look at total cost. The national range for architectural asphalt is $450–$650 per square installed (SmartRoofingCalculator, Oct 2026), or $11,250–$16,250 for a typical 25-square roof. State by state, that 25-square roof runs from $9,800–$14,000 in Arkansas to $13,000–$19,000 in New Jersey — midpoints of $11,900 vs $16,000, a 34% gap.
| Cheapest roof markets | Most expensive roof markets | |
|---|---|---|
| Roof index | Arkansas 86; New Mexico 86; West Virginia 86; Wyoming 86; Mississippi 87 | New Jersey 116; New York 115; Illinois 114; Minnesota 113; California 113 |
| Asphalt $/sq | $390–$560 | $520–$760 (NJ) |
| 25-square roof | $9,800–$14,000 | $13,000–$19,000 (NJ) |
Labor is the main lever: it is roughly 45% of an asphalt roof job, and roofer wages run from $20.36/hr in New Mexico to $34.90/hr in Minnesota (BLS OEWS May 2024) — a 71% gap. Materials narrow the spread, since shingles cost nearly the same everywhere; code widens it again. Metal runs $900–$1,400/sq nationally and tile $1,200–$1,800/sq, and those gaps widen further in high-wage states.
One cross-check worth naming: SquareDash’s 2026 index, built from 8,900+ completed jobs (January 2025–March 2026), puts its national average at $8,450 for a 2,000 sq ft home — lower than the per-square model implies, because it prices one shingle product on its own job mix. Different scope, different average; the state ranking direction agrees (Northeast and West Coast high, South low). We use the SmartRoofingCalculator series in the index because it publishes a full per-square table for all 50 states with its method disclosed.
National pricing: roof replacement cost 2026. Florida pricing: roof replacement cost in Florida 2026.
What the index means for electrical panels and water heaters
No publisher releases panel or water-heater prices state by state, so these two jobs are not in the composite. Instead, the table below scales the national anchors by the index — modeled figures, labeled as such — to show the size of the state effect.
National anchors (2026): a 200-amp panel upgrade averages $1,600 (Angi, Oct 29, 2026), most homeowners paying $1,300–$2,000 for panel + install; a full 100A to 200A service upgrade with meter base and service conductors runs $3,000–$6,000. A like-for-like tank water heater (40–50 gal) runs $882–$1,826 installed, average $1,347 (Angi/HomeAdvisor, July 2026); tankless $1,400–$3,900; heat-pump hybrid $1,200–$3,500.
| Job (modeled from national anchor x index/100) | New Jersey (108) | Mississippi (89) | National |
|---|---|---|---|
| 200-amp panel upgrade | $1,400–$2,160 | $1,160–$1,780 | $1,300–$2,000 |
| Tank water heater, installed | $950–$1,970 | $785–$1,625 | $882–$1,826 |
The modeled gap is about $240–$380 on a panel and $165–$345 on a water heater between the two states — real money, but smaller than the roof or solar gaps, because equipment is a bigger share of these jobs. Two warnings: in high-cost metros the real panel price can exceed the modeled range (North Jersey contractors publish $2,800–$5,500 for 100A to 200A work, permits included), and any page still advertising a 30% federal credit (up to $600) for panel upgrades is citing §25C, which ended for post-2025 installs — the credit is $0 in 2026.
National pricing: electrical panel upgrade cost and tankless water heater cost.
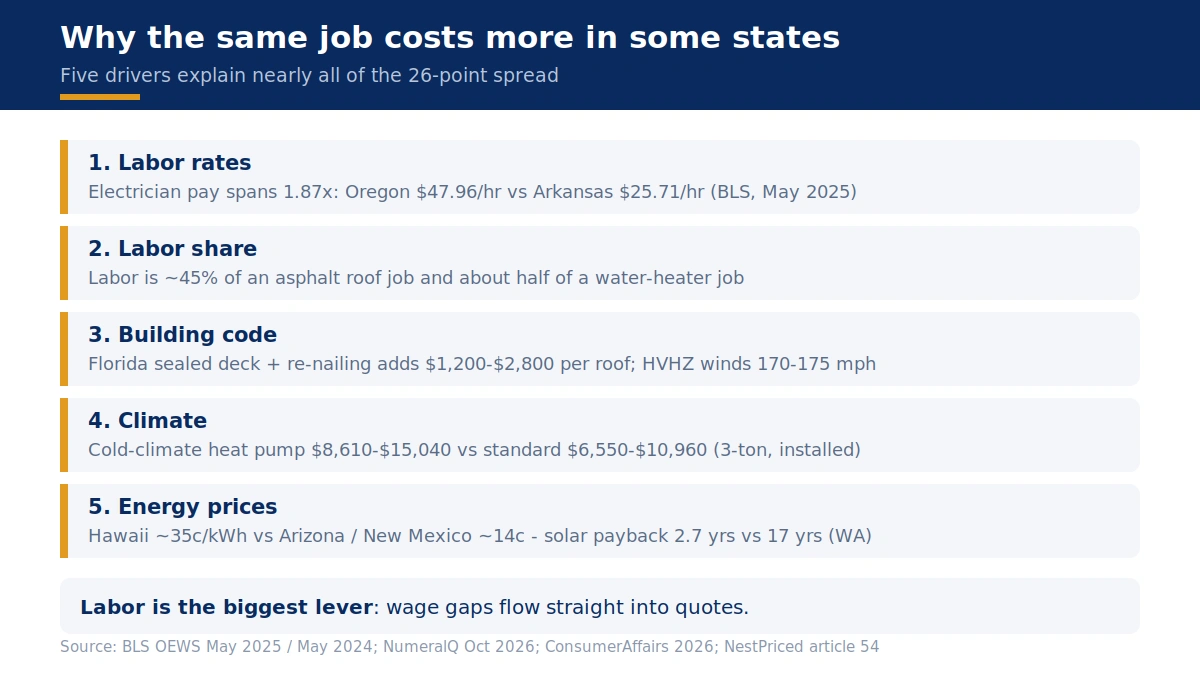
Why home project costs vary by state
Five drivers explain nearly all of the 26-point spread.
1. Labor rates — the biggest lever. Electrician mean wages span 1.87x across states: $47.96/hr in Oregon vs $25.71/hr in Arkansas (BLS OEWS May 2025; national median $30.38/hr, mean $34.37). Roofer wages span 71%: $34.90/hr in Minnesota vs $20.36/hr in New Mexico (BLS OEWS May 2024). Labor is roughly 45% of an asphalt roof and about half of a water-heater job, so wage gaps flow straight into quotes. Billed rates run about 2.0–2.6x pay (insurance, payroll taxes, overhead, profit).
2. Code stringency. Florida’s hurricane code adds a sealed deck plus 8d ring-shank re-nailing ($1,200–$2,800 per job), NOA-approved products, 6-nail fastening, and mandatory dry-in inspections — and 170–175 mph design winds in the Miami-Dade/Broward HVHZ zone. California adds Title 24 energy rules and wildfire-zone (WUI) requirements. Northeast states add snow-load and energy-code requirements. Each one is a line item, not a rounding error.
3. Climate. Cold-climate heat pumps cost more than standard ones: $8,610–$15,040 for a 3-ton cold-climate ducted system vs $6,550–$10,960 standard (NumeralQ, Oct 2026). Minnesota, Maine, New Hampshire, and Vermont pay the cold-climate premium on nearly every install; Florida and Texas mostly do not. Hail belts (Texas, Colorado) add roof demand and storm-driven price spikes.
4. Permitting and interconnection. Heat-pump permits typically run $70–$166 (35 cities checked, NumeralQ, Oct 2026); Florida roof permits run $255–$500. Solar permitting and interconnection are among the largest soft costs in a solar quote, and timelines vary from days to months by jurisdiction. Slow, expensive permitting is a cost even when the fee itself is small, because crews and paperwork sit idle.
5. Energy prices and market maturity. High electricity rates shorten solar payback even where installs are pricey: Hawaii at roughly 35 cents/kWh pays back in about 2.7 years despite $3.43/W installs, while Washington at $2.54/W takes about 17 years (ConsumerAffairs 2026). And installer density matters as much as sunshine: Alabama ($3.85/W) gets more sun than Massachusetts ($2.91/W) but has far fewer competing installers.
The Florida surprise: why a hurricane-code state ranks near-cheapest
Florida at #48 (index 91) is the result most readers will question, so here it is plainly: the index understates real Florida roof costs. The roof series behind the index prices labor plus goods only. It does not price hurricane code.
Our own Florida research (article 54, November 2026, from permit records and contractor pricing) shows architectural shingles at $411–$691 per square statewide — a 20-square home at $8,220–$13,820, with a $16,000 median shingle job in permit records — against the model’s $410–$600/sq. In the Miami-Dade/Broward HVHZ zone the same roof costs $14,000–$26,000. The sealed deck and re-nailing package alone adds $1,200–$2,800.
Florida still ranks low overall because its other two components are genuinely cheap: the lowest solar in America ($2.12/W) and heat pumps 2% below national. If you are budgeting a Florida roof, use the Florida guide, not this index. If you are budgeting Florida solar or a heat pump, the index is a fair guide. Full detail: roof replacement cost in Florida 2026.
How to use this index before you get quotes
- Find your state, then read the component columns, not just the rank. A state can be cheap overall and expensive on your specific job — North Dakota is #5 overall but ordinary on roofs; Oregon is #26 overall but has the highest electrician wages in the country.
- Compare quotes in unit prices, not totals. Solar: dollars per watt. Roofing: dollars per square (100 sq ft). Heat pumps: dollars per ton, same system type and SEER2 tier. Unit prices expose the outlier quote instantly.
- Get three written, itemized quotes. State averages hide 20–30% spreads between contractors in the same city. The index tells you the market; the quotes tell you your price.
- Check incentives before you sign, not after. HEAR rebates up to $8,000 exist for income-qualified households, but availability varies by state and month. State and utility incentives (Massachusetts SMART, New Jersey SuSI, Illinois Shines) are real money — verify current status with the program, not with a salesperson.
- Reject any quote showing “after 30% federal credit” math for 2026. The federal credits (§25C and §25D) ended for property placed in service after December 31, 2025. Gross is net for homeowner-owned installs in 2026. Leases and PPAs are the exception — the provider’s §48E commercial credit runs through December 31, 2027 — and the provider should confirm in writing that it was preserved for your install date.
- Verify the license and the product approvals. In Florida, that means NOA numbers on the estimate; everywhere, it means a license you checked yourself and a permit in the quoted price.
Sources & methodology
The index. NestPriced Home Project Cost Index = 0.40 x roof index + 0.30 x (state heat-pump midpoint / $8,755 x 100) + 0.30 x (state solar $/W winsorized at $3.50 / $2.60 x 100). US average = 100. Computed November 5, 2026; full inputs and output in the research file (files/research/56-50-state-cost-index-2026.md). DC is excluded (not a state).
Component sources. Heat pump: NumeralQ, “Heat Pump Cost 2026“, pricing as of Oct 26, 2026; 3-ton ducted air-source, installed; labor from BLS OEWS May 2025. Solar: ConsumerAffairs, “How Much Do Solar Panels Cost? (2026)“, EnergySage marketplace $/W, September 2026; national $2.60/W; cheapest/most-expensive five cross-checked against BetterHouse (Sep 16, 2026). Roof: SmartRoofingCalculator, “2026 Roofing Cost Index by State“, updated Oct 11, 2026; state $/sq = national $/sq x (0.45 x BLS OEWS May 2024 roofer-wage index + 0.55 x BEA 2024 Regional Price Parity for goods); the source states “no invoices or surveys sit behind these numbers.”
Labor. BLS OEWS May 2025: electricians (SOC 47-2111) national median $30.38/hr ($63,190/yr), mean $34.37/hr; highest state mean Oregon $47.96/hr, lowest Arkansas $25.71/hr. HVAC mechanics/installers national median $29.33/hr. Roofers (SOC 47-2181, BLS OEWS May 2024, via SmartRoofingCalculator): US mean $27/hr; Minnesota $34.90/hr highest, New Mexico $20.36/hr lowest; Florida $22.80/hr.
Panels and water heaters. Angi, “Cost to Upgrade Electrical Panel” (updated Oct 29, 2026): national average $1,600; most pay $1,200–$2,000; 200-amp $1,300–$2,000. HomeAdvisor (Jun 2026): average $1,347; typical $518–$2,193. Full service upgrade $3,000–$6,000 (RemodelCalculators, Sep 27, 2026). Water heater: Angi/HomeAdvisor (Jul 2026): tank $882–$1,826, average $1,347; tankless $1,400–$3,900; heat-pump hybrid $1,200–$3,500. State panel/water-heater figures are the national anchor x index/100 — modeled, not directly sourced.
Worked example (same bundle everywhere: 3-ton heat pump at midpoint + 25-square asphalt roof at midpoint + 8 kW solar at state $/W). National: $8,755 + $13,750 + $20,800 = $43,305. Minnesota: $9,410 + $15,550 + $25,760 = $50,720 (+17% vs national). Mississippi: $8,240 + $12,050 + $18,320 = $38,610 (-11% vs national). Gap: $12,110; Minnesota 31% above Mississippi. Roof midpoints: MN 25-sq $12,800–$18,300; MS $9,800–$14,300; national $11,250–$16,250.
Tax framing. OBBBA (P.L. 119-21) ended §25C/§25D for property placed in service after Dec 31, 2025 — $0 federal credit for 2026 homeowner-owned installs (IRS FS-2025-05, Aug 2025). Alive: HEAR rebates up to $8,000 (income-qualified); §48E via lease/PPA through Dec 31, 2027; state/utility incentives.
Limits. The index is a modeled planning estimate from published series, not a survey of invoices. Solar $/W in thin markets (ND $4.23, NE $3.60, SD $3.46, AL $3.85, TN $3.53, WY $3.51) reflects installer scarcity and small quote samples; winsorized at $3.50 in the composite and flagged. The roof model does not capture hurricane-code adders (see Florida section). Heat-pump figures are 3-ton ducted air-source only; cold-climate and ductless systems differ. SquareDash’s 2026 index (8,900+ jobs, avg $8,450 for a 2,000 sq ft home) is cited as a scope cross-check, not used in the composite. Internal state cross-checks: NestPriced articles 50–54.
—
Which state is the most expensive for home projects in 2026?
Minnesota, at index 115 (US average = 100). It leads on every component: the highest roofer wages in the US ($34.90/hr), heat pumps 7.5% above the national midpoint, and solar at $3.22/W. Hawaii (113) and Alaska (113) follow, then Illinois (112) and North Dakota (110).
Which state is the cheapest for home projects in 2026?
Mississippi, at index 89 — low trade wages, heat pumps 6% below national, and solar at $2.29/W. Arkansas (90), Florida (91), Texas (92), and Louisiana (92) round out the cheapest five.
How is the 50-state home project cost index calculated?
Index = 40% roof index + 30% heat pump index + 30% solar index, each component measured against its national figure (US average = 100). Roof data comes from SmartRoofingCalculator’s 2026 index (Oct 2026), heat pumps from NumeralQ (Oct 2026, 3-ton ducted), solar $/W from EnergySage marketplace data (Sep 2026, $2.60/W national). Solar $/W is capped at $3.50 inside the composite only, because thin-market figures (North Dakota $4.23/W) would otherwise distort the ranking; the published figure is still shown uncapped.
Why does Florida rank near the cheapest when Florida roofs are so expensive?
The roof series behind the index prices labor plus goods only — it does not capture hurricane code. Real Florida roofs run $411–$691 per square statewide ($8,220–$13,820 for a 20-square home, $16,000 median in permit records) and $14,000–$26,000 in the Miami-Dade/Broward hurricane zone, because of the sealed deck, re-nailing, NOA products, and inspections. Florida still ranks low overall because its solar ($2.12/W, cheapest in the US) and heat pumps are genuinely cheap. For a Florida roof budget, use our Florida roof guide, not this index.
How much more does the same project cost in the most expensive state vs the cheapest?
Take the same bundle — a 3-ton heat pump, a 25-square asphalt roof, and an 8 kW solar system. It costs $50,720 in Minnesota vs $38,610 in Mississippi: a $12,110 gap, or 31% more. Nationally the same bundle is $43,305.
Is there a federal tax credit for heat pumps or solar in 2026?
No — $0 for homeowner-owned installs. The One Big Beautiful Bill Act (P.L. 119-21) ended the §25C and §25D credits for property placed in service after December 31, 2025 (IRS FS-2025-05). Any quote showing “after 30% credit” math for 2026 is using dead law. Still alive: HEAR rebates up to $8,000 for income-qualified households, the §48E commercial credit via leases/PPAs through December 31, 2027, and state/utility incentives.
Why does solar cost $2.12 per watt in Florida but $3.85 in Alabama?
Market maturity, not sunshine. Florida has a deep bench of competing installers and simple permitting; Alabama has few installers and little quote competition. Alabama gets more sun than Massachusetts, yet Massachusetts solar is $2.91/W — installer density and program support (SMART) matter more than the weather.
How reliable is this index — can I budget from it?
Treat it as a planning tool, not a quote. It is a modeled index built from three published 2026 series with the method disclosed — not a survey of invoices. Your roof pitch, system type, and contractor all move the real number, and state averages hide 20–30% spreads between contractors in the same city. Use the rank to set expectations, then get three written, itemized quotes and compare them in unit prices: dollars per watt for solar, dollars per square for roofing, dollars per ton for heat pumps.