

Table of Contents
Arizona is the most contradictory solar market in America. It has the best sun in the country — 6.54 peak sun hours a day, #1 in the US (NREL PVWatts v8, 2026) — and some of the cheapest installed prices — $2.25/W, roughly $0.37/W below the national $2.62/W benchmark (EnergySage, November 2026). It also has some of the lowest export payments in the country, cheap electricity that stretches payback, and a 110°F summer that punishes the wrong panel choice.
The result: solar in Arizona is a genuinely good buy — if you size it right, pick the right equipment, and understand your utility’s export rules before you sign. This guide covers all of it, with every figure sourced from 2026 data and the federal credit correctly shown as $0.
Compare with the national solar panel cost guide for the US baseline.
How much do solar panels cost in Arizona in 2026?
The defensible 2026 Arizona consensus: $2.25–$2.60 per watt installed, before the $1,000 state credit. EnergySage’s Arizona state page (updated November 2026) puts the state average at $2.25/W on a 13.34 kW average system costing $30,081 (range $25,569–$34,593). Independent marketplace data agrees: $2.27/W in September 2026 and $2.28/W in August 2026, both citing EnergySage marketplace data.
City-level figures from EnergySage (November 2026) cluster tightly: Scottsdale $2.21/W (16.52 kW average), Tempe $2.22/W, Sun City West $2.17/W, Sun City $2.31/W, Paradise Valley $2.26/W, Fort Mohave $2.28/W. That tight spread — $2.17–$2.31/W across the state — is part of why Arizona ranks among the cheapest solar states in America.
One caution: full turnkey installer quotes in the Phoenix area can run $2.70–$3.30/W (Phoenix Valley Solar, ~September 2026, citing EnergySage + LBNL). That is the higher-end framing — premium equipment, complex tile roofs, or a quote with fat margins. The national benchmark for comparison is $2.62/W (EnergySage Marketplace Report, 23rd edition, September 2026, median quoted solar-only price, H1 2026 data). Arizona sits roughly $0.37/W below it.
The number-one rule of 2026 Arizona pricing: gross = net. The §25D residential federal credit ended December 31, 2025. There is no “after 30% credit” column anymore. Several top-ranking pages still show post-credit prices — treat those as outdated. Every figure in this guide is the price you actually pay on an owned system, minus only Arizona’s $1,000 state credit.
Arizona systems are also unusually large. The state average is 13.34 kW (EnergySage, November 2026) — more than double the ~6 kW US average — because air conditioning drives huge summer loads. Do not size by the national benchmark. Size by your last 12 months of kilowatt-hours.
Solar panel cost by system size in Arizona
2026 installed costs at the EnergySage anchor of $2.25/W, with the high end of the anchor range ($2.60/W) alongside. These are before the $1,000 Arizona state tax credit — subtract up to $1,000 from any line below if you have Arizona income-tax liability.
| System size | Cost at $2.25/W | Cost at $2.60/W | Best fit |
|---|---|---|---|
| 5 kW | $11,250 | $13,000 | Small home, low daytime use |
| 6 kW | $13,500 | $15,600 | Small-to-mid home |
| 8 kW | $18,000 | $20,800 | Typical home (our worked example) |
| 10 kW | $22,500 | $26,000 | Large home, heavy AC |
| 12 kW | $27,000 | $31,200 | Very large home, pool + EV |
| 13.34 kW (AZ average) | $30,081 (range $25,569–$34,593) | — | The average Arizona install |
After the state credit, the worked example is simple: an 8 kW system at $2.25/W costs $18,000 gross and $17,000 net after the $1,000 state credit. There is no other subtraction in 2026.
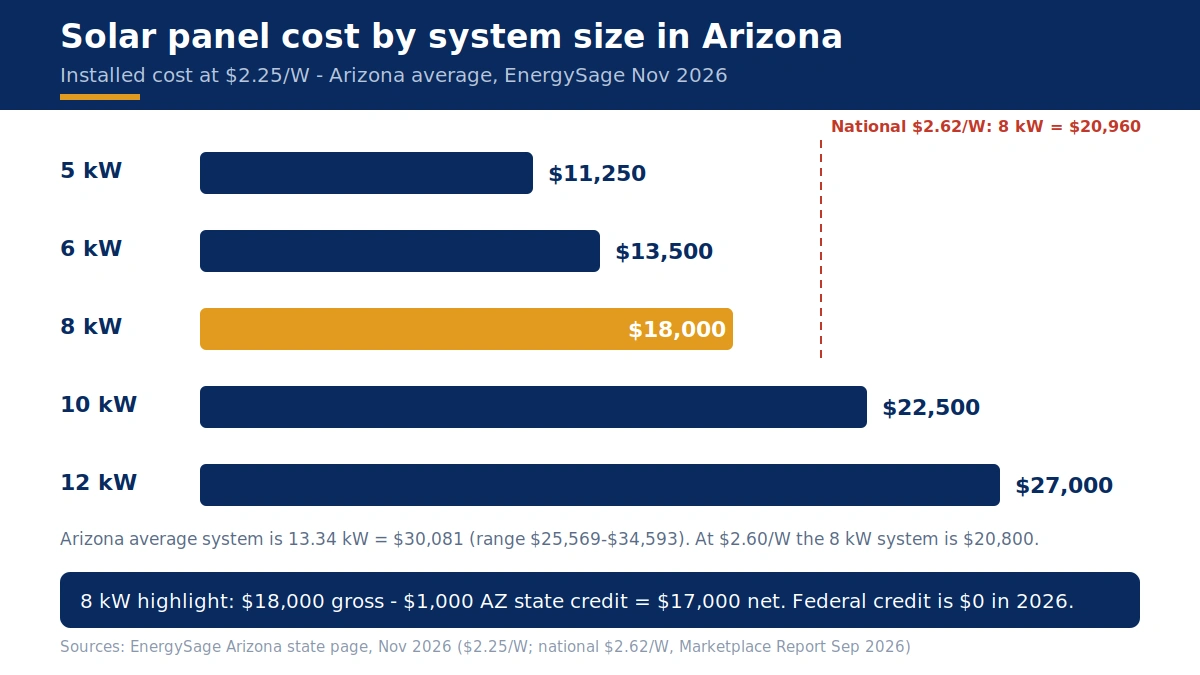
City spot-checks for the average system (EnergySage, November 2026): Scottsdale’s 16.52 kW average runs $36,538; Tempe’s 13.91 kW average runs $30,938. The pattern is consistent: Arizona homeowners buy big because the sun is strong, the per-watt price is low, and the AC load is enormous.
What drives your price per watt
Equipment tier. Panels, inverter, racking, and wiring are roughly 36% of a typical project cost nationally (EnergySage installer survey, via our California guide). Premium panels with low temperature coefficients cost more per watt — in Arizona, that premium buys real production on 110°F afternoons (see the heat section below).
Tile-roof labor. Tile is the Arizona default roof, and solar mounts on tile require removing and reinstalling tile around each penetration — more labor than shingle. No Arizona-specific tile-mount cost adder was verified in our research, so no dollar figure is given here; ask installers to itemize the tile work. If your roof has under 10 years of life left, replace it first — our tile roof cost guide and roof replacement cost guide cover the roofing side.
Electrical panel upgrade (if needed). A national planning range of $2,500–$4,500 (NRG Clean Power, November 2026) is commonly quoted — flag it as a California-sourced national range, not an Arizona-verified figure. Get it itemized on your quote either way.
Permitting and interconnection. Nationally, permitting and interconnection run about 8% of system cost (EnergySage). Arizona’s HB2301 requires every municipality and county to offer instant solar permitting as of January 1, 2026 — that is a single-source report (solarpermitsolutions.com, 2026), so verify it with your installer rather than counting on it. Ask for the interconnection fee as a line item; APS, SRP, and TEP timelines typically run weeks.
Installer overhead. Roughly 42% of a typical project nationally is overhead, sales, and margin (EnergySage installer survey). That is why identical equipment quotes vary 20–40% between installers — and why three quotes are non-negotiable.
The 30% federal tax credit is gone — what that means for 2026 math
The §25D Residential Clean Energy Credit (30%) was terminated by the One Big Beautiful Bill Act (OBBBA, P.L. 119-21, signed July 4, 2025), Section 70506, for expenditures made after December 31, 2025. The IRS confirmed the rule in FS-2025-05 (August 21, 2025): an expenditure counts as “made” when installation is completed. If installation finishes after December 31, 2025, there is no credit.
For a homeowner-owned system installed in 2026 — cash or loan — the federal credit is $0. Gross quoted price is the real out-of-pocket price, minus only Arizona’s $1,000 state credit. One nuance: an unused §25D credit from a 2025 install can be carried forward to 2026 (Form 5695 instructions, 2025) — but that is a carryforward of a 2025 credit, not a credit for 2026 work.
The one surviving federal path: §48E through a lease or PPA. The Clean Electricity Investment Credit (30%) survives only for the business that owns the system. On a residential roof, that means a lease or power purchase agreement, with systems placed in service by December 31, 2027 (for construction begun after July 4, 2026). The lessor claims the credit and may pass savings through as a lower monthly payment — you do not get a tax credit yourself. Our federal energy tax credits guide covers the full post-OBBBA landscape.
Watch for quotes still subtracting 30%. It is the most common stale-math trap in 2026 solar pricing, and it is exactly the trap this guide exists to warn you about.
Arizona incentives that survive: $1,000 state credit + no sales tax + no property tax
Arizona’s state stack is small but real — and unlike the federal credit, all three pieces are still in state law.
| Incentive | 2026 status | Value |
|---|---|---|
| Federal §25D residential credit | Expired Dec 31, 2025 — $0 | $0 |
| Arizona Residential Solar Tax Credit | Active — no expiration date | 25% of system cost, capped at $1,000 per residence (lifetime); nonrefundable; unused credit carries forward up to 5 years; claim on Arizona Form 310 (with Form 301); owned systems only — leases/PPAs do not qualify (A.R.S. §43-1083) |
| Property tax exemption | Active, permanent | 100% of added home value excluded from assessment — solar adds $0 to taxable value; no form to file; typical saving $100–$300/yr in Maricopa County (A.R.S. §42-11054) |
| Sales-tax (TPT) exemption | Active | Solar equipment + installation exempt from Arizona Transaction Privilege Tax (5.6% state rate; ~7–9% with local); worth an estimated ~$1,200–$1,500 on a typical system (A.R.S. §42-5061(M)) |
| APS / SRP / TEP solar panel rebates | None in 2026 | $0 — no upfront solar rebate from any of the three utilities |
| §48E (lease/PPA route) | Alive through Dec 31, 2027 — only via third-party ownership | 30% to the lessor, not the homeowner |
Worked example — 8 kW at $2.25/W = $18,000: gross $18,000, with the TPT exemption already reflected in the quoted price (confirm with your installer), minus the $1,000 state credit if you have Arizona tax liability, for a $17,000 net. The property-tax exemption then saves roughly $100–$300 a year on an ongoing basis, on the ~$18,000–$20,000 of added home value.
Two honest caveats. First, the TPT exemption is a tax-base deduction for the retailer — the seller must be registered with the Arizona Department of Revenue as a solar energy retailer — not an automatic percentage discount on every contract, and local city privilege taxes may still apply unless the municipality exempts them. The ~$1,200–$1,500 saving is an installer estimate, not a guaranteed figure: ask for itemized tax treatment. Second, these are general information, not tax advice — confirm with a tax professional.
No Arizona Solar for All program was verified for 2026. We checked and could not confirm a state low-income solar program; do not assume one exists. Verify current programs in the DSIRE directory (programs.dsireusa.org, run by NC State University) before counting on any low-income support.
No net metering: what APS, SRP and TEP actually pay for exports
Arizona ended full-retail net metering in 2016–2017 (ACC Decision No. 75859, December 2016). New solar homes get net billing: electricity your home consumes directly offsets the full retail rate (~15¢/kWh, or 30–37¢ on-peak), but electricity you export earns a much lower utility-set credit. Your utility — not the state — sets what exports are worth, and the three big utilities pay very differently.
| Utility | New-applicant export credit (2026) | Lock | Reset |
|---|---|---|---|
| APS | 5.554¢/kWh (Sep 1, 2026–Aug 31, 2027 tranche) | 10 years | Each Sep 1, max −10%/yr |
| TEP | 4.62¢/kWh (Oct 1, 2026–Sep 30, 2027) | 10 years | Each Oct 1, max −10%/yr |
| UNS Electric | 5.51¢/kWh (from Oct 1, 2026) | 10 years | Each Oct 1 |
| SRP (E-16/E-28) | 1.87¢/kWh (from May 2026) | None — resets each May | Each May |
| SRP (E-13 legacy) | 3.45¢/kWh | None | Ends Nov 2029 → E-28 |
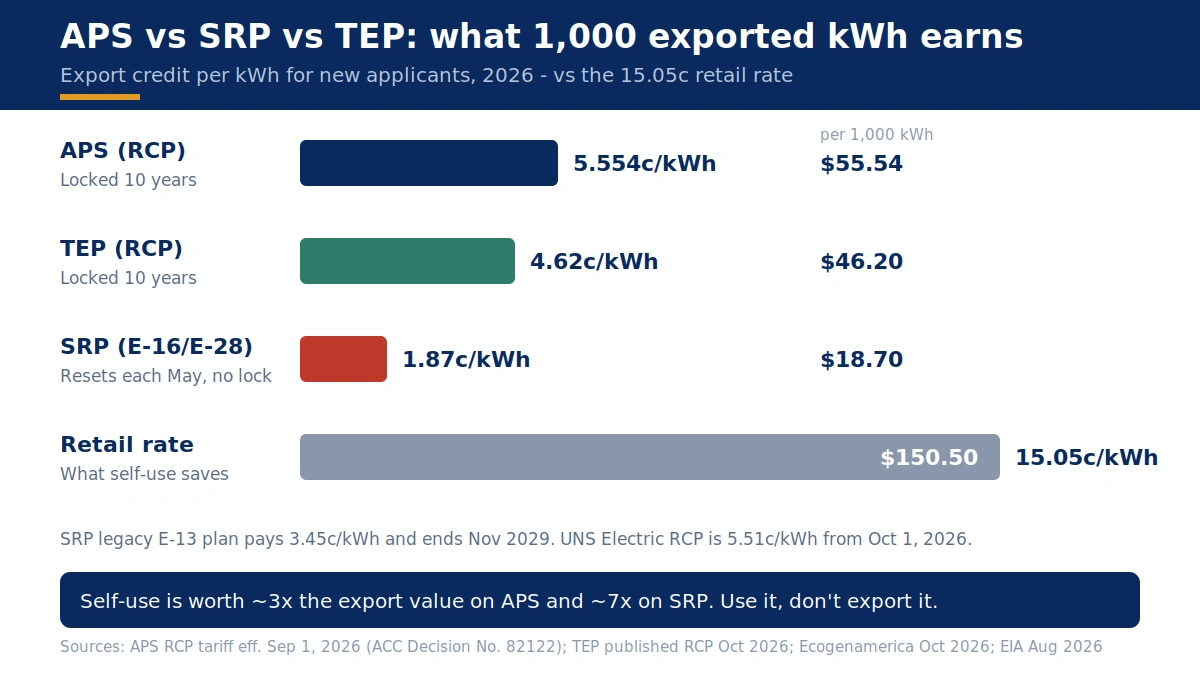
APS — Resource Comparison Proxy (RCP). The primary source is the APS Rate Rider RCP tariff (aps.com), effective September 1, 2026 per ACC Decision No. 82122: the 2026 tranche (September 1, 2026–August 31, 2027) is $0.05554/kWh (5.554¢). Prior tranches stepped down 10% a year: 2025 was $0.06171, 2024 $0.06857, 2023 $0.07619, 2017 $0.12900. A new tranche is set each September 1, the rate is locked for 10 years from interconnection, the annual step-down is capped at 10%, and the rate is flat — the same credit at noon and at 7 PM, with no time-of-use bonus for exports. Your interconnection application generally must complete within 180 days (270 for APS) of submission to claim a tranche.
Two conflicting secondary figures must not be used: one installer blog cites “$0.0846/kWh for 2026” and another page cites “$0.0747/kWh” — both contradict the APS tariff PDF itself. The 8.46¢ figure appears to be an error or a legacy tranche. Use 5.554¢ for new September 2026–August 2027 applicants. Earlier tranches keep their higher locked rates.
TEP (Tucson) — RCP. The RCP for October 1, 2026–September 30, 2027 is $0.0462/kWh (4.62¢), confirmed by two independent secondary sources citing TEP’s published rate (reviewed October 12, 2026). The prior rate was 5.13¢ (October 2025–September 2026). It resets each October 1, is locked up to 10 years from interconnection application, with a maximum 10% annual decline. TEP solar customers must enroll in a time-of-use plan. Older pages still cite 5.1¢ or 5.7¢ — those are pre-October-2026 tranches. Note: the 4.62¢ figure rests on two secondary sources citing TEP’s published rate, not the TEP tariff PDF itself — confirm at tep.com at publish time.
SRP — the complicated one. SRP does not use the RCP. It sets its own solar price plans, reset each May, with no 10-year lock — the rate can change for every home on the plan each year. The current main solar plans, E-16/E-28, pay 1.87¢/kWh from the May 2026 billing cycle (rates read September 30–October 7, 2026). The older E-13 export plan pays 3.45¢/kWh but is being phased out and ends November 2029, when customers move to E-28. The legacy demand plan E-27 is frozen to new participation (November 2025) and eliminated November 2029 — and its export rate is not given as a single number here because sources disagree by roughly 2× (about 6.5¢, about 2.8¢, and 5.2¢ on-peak / 2.9¢ off-peak, depending on the source). Verify live at srpnet.com.
The self-consumption math — the article’s key insight: a self-consumed kilowatt-hour is worth ~15¢ (or 30–37¢ on-peak at APS); an exported kilowatt-hour is worth 1.9–5.6¢. Self-use is worth ~3× (APS) to ~7× (SRP) the export value. Oversizing a system hurts more in Arizona than in net-metering states — every exported kilowatt-hour is a low-value kilowatt-hour.
APS vs SRP vs TEP: your utility decides your payback
The export table above is only half the story. The three utilities also charge for power very differently — and the rate structure matters as much as the export rate.
APS (Arizona Public Service) serves ~1.29 million residential customers — much of metro Phoenix outside SRP territory, plus Flagstaff, Prescott, and Yuma. It is investor-owned and regulated by the Arizona Corporation Commission (ACC), with time-of-use plans and no demand charge on standard solar plans. The EIA-861 average is 17.0¢/kWh (2025); on the R-TOU-E plan, off-peak is 15.0¢ and the summer peak is 37.1¢/kWh (4–7 PM weekdays), with a $13.94/month service charge (tariffs checked November 4, 2026). Typical all-in cost is ~18.3¢/kWh at 1,054 kWh/month. APS went through a rate case with a settlement approved by the ACC in January 2026 and updated schedules effective February 2026 (secondary source). A further ~14% residential increase was reported as a proposal in July 2026 — that is an unverified proposal, not an approved rate, and is not stated as fact here.
SRP (Salt River Project) serves ~1.07 million residential customers — Mesa, Tempe, Chandler, Scottsdale, Gilbert, and central Phoenix. It is quasi-governmental and not ACC-regulated — it sets its own rates via an elected board — and its solar plans are demand-based. The EIA-861 average is 14.0¢/kWh (2025); standard plans run ~11–14¢/kWh plus a demand charge. The demand charge is billed on your highest 30-minute integrated kW demand during on-peak hours in the billing cycle. The commonly cited figure is around $9/kW on-peak — presented as an approximation, because SRP’s own rate book uses tiered per-kW charges (first 3 kW / next 7 kW / additional, summer vs winter). One 8 kW grid draw in a hot evening hour costs roughly $73/month in demand charges at that figure. The on-peak window for SRP solar plans is typically 2–8 PM weekdays. Two further SRP details are single-source and flagged as unverified: a monthly service charge of ~$20.44 and forfeiture of unused export credits at the 12-month anniversary.
TEP (Tucson Electric Power) serves Tucson metro, Oro Valley, Marana, Sahuarita, and Green Valley. It is investor-owned and ACC-regulated; solar customers must take a time-of-use plan. Residential rates run ~12–16¢/kWh (2026), with retail around 13¢/kWh.
Statewide context: Arizona’s residential average is 15.05¢/kWh (EIA Electric Power Monthly, Table 5.6.A, August 2026, released October 28, 2026) vs 18.16¢/kWh nationally — 17.1% below the US average, 16th lowest of 51 jurisdictions. The average monthly bill is $157.15 on an annual-average basis, but $269.26 in August (summer AC peak, 1,789 kWh) — August bills run nearly double the annual average because of air conditioning. Arizona’s cheap power is the headwind for solar payback; the sun is the tailwind.
For comparison, California’s NEM 3.0 pays roughly 4–8¢ per exported kilowatt-hour against much higher retail rates — and Texas has no net metering either, with buyback plans at 3–8.5¢. Arizona’s split — 1.87¢ to 5.554¢ depending on utility — is wider and more utility-dependent than either.
Do you need a battery in Arizona in 2026?
In Arizona, a battery is not a luxury add-on. It is the tool that fixes the export problem. Export rates of 1.9–5.6¢ vs retail 15¢ (30–37¢ on-peak at APS) make a stored kilowatt-hour worth 3–7× an exported kilowatt-hour. A battery shifts midday surplus to the 4–7 PM (APS) / 2–8 PM (SRP) peak, where it offsets the most expensive power and — on SRP — cuts the demand charge.
Arizona’s battery attach rate is ~47% of new residential solar installs (Energy Storage News, January 19, 2026) — among the highest in the US, driven by low export rates plus APS/SRP demand and time-of-use structures.
Cost. No Arizona-specific battery $/kWh benchmark was found, so these are national anchors: a Tesla Powerwall 3 (13.5 kWh) runs ~$15,000 installed with new solar (Solar.com marketplace, September 2026), the installed battery range is $1,100–$2,100 per usable kWh, and a single 10–13.5 kWh system runs $10,000–$16,000 (Solar.com / IntegrateSun, 2026). A planning adder of $8,000–$15,000 is consistent with those anchors — use it as a planning range, not an Arizona-specific price. An 8 kW solar system ($18,000) plus one Powerwall 3 (~$15,000) is roughly $33,000 gross before the $1,000 state credit.
No upfront solar or battery rebate from APS or SRP in 2026. Battery value comes from virtual power plant (VPP) performance payments, not a purchase rebate:
| Program | Terms |
|---|---|
| APS Storage Rewards Pilot | $110 per kW (average kW reduced across demand-response events), paid once per year; pilot period July 2025–July 2030; administered by EnergyHub |
| SRP Battery Partner Program | $55 per average kW, twice a year (bill credits at end of summer + winter seasons); SRP never discharges below 20%; pilot approved 5 years, ends April 30, 2030, max 5,000 customers; partners: Enphase, FranklinWH, Tesla, SolarEdge |
Does a battery pay in Arizona? On APS, often yes — it shifts exports (5.55¢) into peak self-use (30–37¢ summer), plus roughly $110/kW/year in VPP pay (a 10 kW-capable battery discharging ~5 kW average across events is roughly $550/year in VPP pay alone). On SRP, it is the strongest case in the state — exports earn only 1.87¢, and the battery attacks the demand charge (one bad evening hour can cost ~$73/month). SRP + battery is close to near-mandatory for good economics; SRP + solar-only is the weakest payback in Arizona. On TEP, the case is moderate — 4.62¢ export vs ~13¢ retail; a battery helps but less dramatically than on SRP.
Our solar battery cost guide has the full national battery pricing depth; do not re-derive battery $/kWh here.
Arizona has the best sun in America — and the hottest panels
Arizona’s production numbers are the best in the country. 6.54 peak sun hours per day — #1 in the US (US average 4.98), per NREL PVWatts v8, 2026 NSRDB data. Annual production runs 1,755 kWh/kW/yr (PVWatts v8, Phoenix) to 1,790–1,840 kWh/kW/yr across Arizona cities (PVGIS v5.2 model, Solar Learning Lab, August 17, 2026, south-facing, 30° tilt, 14% losses). By city: Tucson 1,840, Yuma 1,836, Phoenix 1,807, Mesa 1,792, Flagstaff 1,790 kWh/kW/yr. The spread is under 3% between the best and worst Arizona city — every city in the state is a strong solar bet. Flagstaff, at 7,000 feet elevation with snow, still produces 1,790 kWh/kW/yr.
The planning figure: ~1,755–1,840 kWh/kW/yr; use ~1,800 as a round planning figure and ~14,000 kWh/yr for an 8 kW system. An 8 kW system roughly covers a typical Arizona home’s annual usage (~12,500 kWh/yr, ~1,044 kWh/month annual average) — but the seasonal mismatch matters: summer AC demand peaks when production peaks, while winter production still exceeds winter usage, so exports (at 2–5.6¢) are unavoidable without a battery. Rank cities by utility and rate plan (APS vs SRP territory), not by sun — the sun barely differs.
Heat — panels lose output on the hottest afternoons, but Arizona still wins annually. Panels are rated at 25°C (77°F) cell temperature (standard test conditions). Phoenix rooftop cells reach 65–75°C (150–170°F) on summer afternoons. The temperature coefficient tells you how much output falls per degree: standard PERC panels run −0.34 to −0.40%/°C, a 16–21% output loss at 71°C cell temperature; TOPCon (n-type) runs −0.28 to −0.35%/°C (13–16%); HJT runs −0.24 to −0.28%/°C (11–13%). Rule of thumb: a −0.35%/°C panel on a 104°F Phoenix afternoon loses ~14% of rated power at that moment.
The net effect is still strongly positive: annual production of 1,755–1,840 kWh/kW/yr already nets out heat losses (PVWatts/PVGIS models include temperature derating). The best production months are February–May (mild and clear). Buyer tip: compare the temperature coefficient (Pmax) on each quote’s datasheet — closer to zero is better in Arizona; TOPCon/HJT carry a smaller heat penalty than budget PERC. Monsoon dust needs occasional cleaning, but no Arizona-specific soiling percentage was verified — do not invent one.
Panel warranties (typically 25-year performance, at least 80% output at year 25) apply regardless of climate.
HOA rights: Arizona law protects your panels
Arizona has among the strongest HOA solar protections in the US — and two statutes do the work, not one.
- A.R.S. §33-439 — any deed restriction, covenant, or contract provision that effectively prohibits installing or using a solar energy device is void and unenforceable. It applies to all residential property.
- A.R.S. §33-1816 (Planned Communities Act) — an HOA cannot prohibit installation or use of a solar energy device. It may adopt reasonable placement and aesthetic rules only if they do not prevent installation, impair functioning, restrict use, or adversely affect cost or efficiency. There is no fixed percentage threshold in the statute — the Texas-style “10% output” test does not exist in Arizona law and must not be imported. If a homeowner substantially prevails in court against the HOA board, the court must award reasonable attorney fees and costs.
Two honest gaps: the planned-community protection does not apply to condominiums, and HOAs may still require an architectural application — submit it, do not skip it. An HOA can still enforce reasonable appearance rules; what it cannot do is use those rules to block, cripple, or price-gouge your system.
Payback & 25-year savings math
Published benchmarks. EnergySage (November 2026) puts Arizona payback at 12.9 years for the 13.34 kW average system, with 25-year savings of $36,864. City pages: Scottsdale 12.78 years ($46,730), Sun City 12.82 ($39,449), Sun City West 11.57 ($39,605), Tempe 15.08 ($26,354), Paradise Valley 14.98 ($35,031), Fort Mohave 13.58 ($31,666), Arizona City 14.26 ($29,486). The national cash payback in 2026 is 9–13 years.
Our range: ~11–13 years for an APS customer, ~13–15 years for SRP solar-only. SRP’s 1.87¢ export rate plus demand charges stretch payback; a battery shortens SRP payback. EnergySage’s 12.9-year statewide figure sits in the middle because the average Arizona system is oversized (13.34 kW means more low-value exports).
Worked model: 8 kW system, APS territory. Every line is shown — this model is ours, not EnergySage’s, and the assumptions are stated below.
| Line | Math | Result |
|---|---|---|
| Gross installed cost | 8,000 W × $2.25/W | $18,000 |
| Less AZ state tax credit | 25% of cost, capped at $1,000 | −$1,000 |
| Net cost | $17,000 | |
| Annual production | 8 kW × 1,755 kWh/kW/yr | ~14,040 kWh/yr |
| Self-consumed (60%, no battery) | 8,424 kWh × 15.05¢ retail | $1,268/yr |
| Exported (40%) | 5,616 kWh × 5.554¢ APS RCP | $312/yr |
| Year-1 savings | ~$1,580/yr | |
| Simple payback (net cost) | $17,000 ÷ $1,580 | ~10.8 years |
| Simple payback (gross cost) | $18,000 ÷ $1,580 | ~11.4 years |
| 25-yr gross savings | $1,580/yr escalating ~2.5%/yr (electricity inflation), less ~0.5%/yr panel degradation | ~$50,700 |
| Less inverter replacement (once, ~yr 12–15) | −$2,000 | |
| Less net system cost | −$17,000 | |
| 25-year net savings (modeled) | ~$31,000–$32,000 |
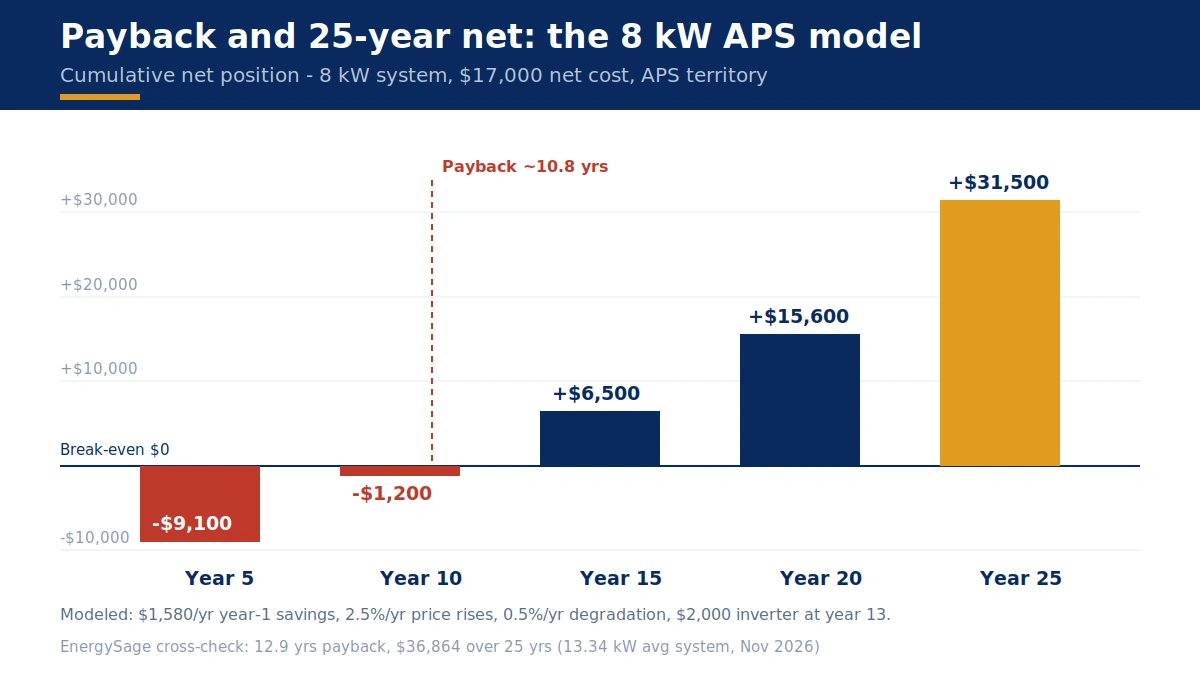
Assumptions, stated plainly: 60% self-consumption without a battery (a battery raises this to ~70–80% and raises year-1 savings); 2.5%/yr electricity-price escalation; 0.5%/yr degradation; one inverter replacement ~$2,000; APS RCP 5.554¢ locked 10 years then assumed to keep stepping down (conservative: the model holds export value flat after year 10). EnergySage’s $36,864 is for a larger 13.34 kW system, not this 8 kW model. The payback chart’s Year 15 (+$6,500) and Year 20 (+$15,600) points are modeled interpolations between the 10.8-year break-even and the 25-year net — not published benchmarks.
SRP-territory version: the same 8 kW system at 1.87¢ export gives year-1 savings of ~$1,373/yr (self-use $1,268 + exports $105) and payback of ~12.4 years net (before demand charges) — but demand charges can add $30–$70/month if unmanaged, which is why SRP payback is quoted as a range, not a point.
Annual savings for a typical 8 kW system: APS, no battery, ~$1,580/yr. With a battery (75% self-consumption), ~$1,850/yr. An 8 kW system producing ~14,000 kWh/yr against ~12,500 kWh/yr of typical usage covers the annual bill — leaving a small residual, because fixed charges ($13.94/month APS; ~$20/month SRP, single-source) survive any system size.
Arizona’s scale, for context: 13,198 MWdc installed (September 2026, SEIA/Wood Mackenzie), powering 1,953,899 homes, with 337,098 installations and 18,435 MW projected over the next 5 years — ranking 3rd nationally. About 18.23% of state electricity comes from solar.
How to get quotes in Arizona + red flags
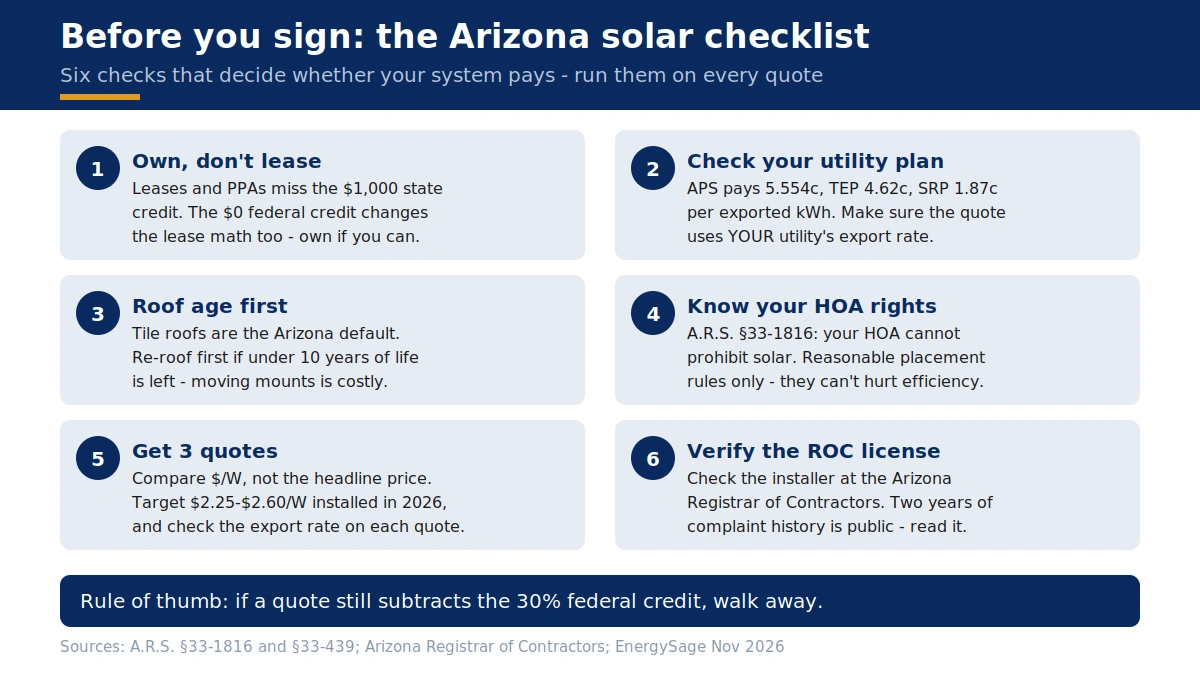
Get three or more installer quotes, and use the same question list every time so the answers compare:
- What’s my $/W before any incentives? The Arizona benchmark is $2.25–$2.60/W. Anything above $3.30/W needs a justification (complex tile roof, premium equipment, difficult permitting).
- Does the quote subtract the 30% federal credit? If yes, it is using dead law. Ask them to remove it.
- Is the savings model using retail rate for all production? If yes, it ignores the 2–5.6¢ export reality. Ask for self-consumption and export shown as separate lines.
- Does the export rate on the quote match MY utility? The #1 Arizona-specific trap: SRP quotes modeled on APS’s RCP rate. If you are on SRP, the export figure should be 1.87¢, not 5.554¢.
- Is it a lease or PPA? If so, ask how the §48E value flows to you — the lessor claims the credit, and the discount should show in the monthly payment.
- What’s the panel temperature coefficient, and what’s the inverter warranty? In Arizona heat, both matter more than the panel brand name.
- Is the installer licensed with the Arizona Registrar of Contractors, and what’s the 2-year complaint history?
Red flags from real Arizona cases. The Arizona Attorney General, DOJ, and FTC sued Vision Solar LLC (July 2023) for unsubstantiated savings claims, false claims of utility and government affiliation, and calling Do-Not-Call numbers; lead generator Solar Xchange settled with a partially suspended $13.8 million penalty. Classic traps alleged: “your solar payment replaces your electric bill” and “savings start immediately” — while buyers paid both a loan and a utility bill for months before systems operated. Titan Solar Power, which started in Arizona, closed in 2024, leaving orphaned customers with warranties in limbo. The Arizona Corporation Commission is also active: in November 2026 it ordered a Mesa solar-company founder to pay $2,433,000 in restitution for misappropriating ~$984,696 of investor funds (ACC docket S-21386A-26-0029) — an investor-side fraud case, cited only as evidence the regulator is active in Arizona solar.
Where to complain: the Arizona Registrar of Contractors (licenses contractors, investigates complaints; 2-year complaint history visible on its site; can direct fixes, suspend, or revoke licenses); the Arizona Attorney General consumer-fraud line (Phoenix (602) 542-5763; Tucson (520) 628-6648; elsewhere (800) 352-8431); harmed homeowners can claim from the Residential Contractors’ Recovery Fund, capped at $30,000 per homeowner. Door-to-door sales carry a 3-day right to cancel under the FTC Cooling-Off Rule (16 CFR Part 429) for sales of $25 or more. And no “free solar” or “government program” gives away panels — there is no such program.
Sources & methodology
Cost anchors: EnergySage Arizona state page (November 2026: $2.25/W, 13.34 kW average system, $30,081, range $25,569–$34,593; city pages Scottsdale $2.21/W 16.52 kW, Tempe $2.22/W, Sun City West $2.17/W, Sun City $2.31/W, Paradise Valley $2.26/W, Fort Mohave $2.28/W); EnergySage marketplace data via solarenergysupplystores.com (September 2026: $2.27/W, avg system $30,408); Home Solar Atlas (August 27, 2026: $2.28/W, citing EnergySage marketplace); betterhouse.io (September 2026: $2.28/W, citing EnergySage); Phoenix Valley Solar (∼September 2026: Phoenix-area turnkey $2.70–$3.30/W, citing EnergySage + LBNL); EnergySage Marketplace Report 23rd edition (September 2026, H1 2026 data: national median $2.62/W solar-only, $2.57/W all quotes). Size table calculated from the $2.25/W anchor at $2.60/W high end.
Electricity rates: EIA Electric Power Monthly Table 5.6.A (August 2026, released October 28, 2026: Arizona residential 15.05¢/kWh, US 18.16¢/kWh, AZ avg monthly bill $157.15 annual-average basis / $269.26 in August, 1,789 kWh); EIA via priceofelectricity.com (August 2026: 17.1% below US average, 16th lowest of 51 jurisdictions); EIA Form 861 annual data via wattcosts.com (2025 annual, verified October 23, 2026: 15.59¢/kWh); EIA via Solar Learning Lab (May 2026: 15.23¢/kWh). APS R-TOU-E plan details (off-peak 15.0¢, summer peak 37.1¢/kWh 4–7 PM weekdays, $13.94/mo service charge; tariffs checked November 4, 2026, homewattcost.com); EIA Form 861 2025: APS ~1.29M residential customers, 17.0¢/kWh avg; SRP ~1.07M residential customers, 14.0¢/kWh avg.
Export rates: APS Rate Rider RCP tariff (aps.com), effective September 1, 2026 per ACC Decision No. 82122 — 2026 tranche $0.05554/kWh (prior tranches 2025 $0.06171, 2024 $0.06857, 2023 $0.07619, 2017 $0.12900); ACC vote August 13, 2026 approving the 10% RCP reduction for APS and UniSource (Vote Solar). TEP RCP 4.62¢ for October 1, 2026–September 30, 2027 (prior 5.13¢), confirmed by two independent secondary sources citing TEP’s published rate (backupreadyarizona.com, reviewed October 12, 2026; ecogenamerica, October 2026; solarmastermindusa.com, October 2026). UNS Electric RCP 5.51¢/kWh from October 1, 2026 (was 6.12¢) (ecogenamerica, October 2026). SRP E-16/E-28 1.87¢/kWh from May 2026, E-13 3.45¢/kWh ending November 2029, E-27P pilot frozen November 2025 and eliminated November 2029 (ecogenamerica, October 2026, rates read September 30–October 7, 2026; SRP rate book, effective November 2025 billing cycle). SRP solar price plans — verify live at publish time.
Incentives: A.R.S. §43-1083 (25% up to $1,000, Form 310, 5-year carryforward, owned systems only), confirmed by ecogenamerica (October 2026), exspenditure.com (April 2026, verified against azdor.gov + azleg.gov), SolarReviews (November 2026), theenergygrid.com (September 2026); A.R.S. §42-11054 (property-tax exemption, 100% of added value, no form to file; $100–$300/yr Maricopa County saving per exspenditure, April 2026); A.R.S. §42-5061(M) + §42-5075 (sales-tax/TPT exemption; TPT saving ~$1,200–$1,500 installer estimates per exspenditure and greensavehome; retailer-registration nuance per phoenixsolarpanelsystems.com, October 2026; local city taxes per legalclarity.org). OBBBA P.L. 119-21 (signed July 4, 2025), IRS FS-2025-05 (August 21, 2025, FAQ 7). DSIRE directory (programs.dsireusa.org, NC State University) — verify all four Arizona items there at publish time. No APS/SRP/TEP upfront solar rebate found in 2026 (ecogenamerica, October 2026; iconpower.com, October 2026).
Production: NREL PVWatts v8, 2026 NSRDB data via thegreenwatt.com (6.54 peak sun hours/day, #1 US; 1,755 kWh/kW/yr Phoenix); Solar Learning Lab PVGIS v5.2 runs (August 17, 2026: 1,790–1,840 kWh/kW/yr by city; Tucson 1,840, Yuma 1,836, Phoenix 1,807, Mesa 1,792, Flagstaff 1,790; under 3% spread). Typical Arizona home usage ~1,044 kWh/month (~12,500 kWh/yr) (EIA, August 2026).
Battery: Powerwall 3 (13.5 kWh) ~$15,000 installed with new solar (Solar.com marketplace, September 2026 — national anchor); installed battery range $1,100–$2,100 per usable kWh; single 10–13.5 kWh system $10,000–$16,000 (Solar.com / IntegrateSun, 2026); battery attach rate ~47% (Energy Storage News, January 19, 2026); APS Storage Rewards Pilot $110/kW/year, July 2025–July 2030 (EnergyHub T&Cs; Energy Storage News, January 19, 2026; FranklinWH/Solar Power World, January 14–15, 2026); SRP Battery Partner program ($55/avg kW twice yearly; pilot ends April 30, 2030; max 5,000 customers; partners Enphase, FranklinWH, Tesla, SolarEdge — srpnet.com, accessed November 2026). ConnectDER IslandDER approved by APS, SRP, and TEP (Energy Storage News, January 19, 2026).
Heat/panels: ExploreSolar (February 2026: rooftop cell temps 65–75°C; temperature coefficients PERC −0.34 to −0.40%/°C, TOPCon −0.28 to −0.35%/°C, HJT −0.24 to −0.28%/°C; 16–21% loss at 71°C cell temp); MySolarFY (August 2026: ~14% loss at 104°F for a −0.35%/°C panel); Phoenix Valley Solar (2026).
HOA: LegalClarity (2026, citing azleg.gov): A.R.S. §33-439 (deed restrictions void) and §33-1816 (planned communities; attorney-fees provision; condo gap).
Payback model: EnergySage Arizona state page (November 2026: 12.9-year payback, $36,864 25-year savings, 13.34 kW system; city payback figures Scottsdale 12.78, Sun City 12.82, Sun City West 11.57, Tempe 15.08, Paradise Valley 14.98, Fort Mohave 13.58, Arizona City 14.26 years). The 8 kW worked model is our arithmetic with stated assumptions (60% self-consumption, 2.5%/yr escalation, 0.5%/yr degradation, $2,000 inverter replacement, RCP flat after year 10).
Scams/enforcement: AZ Attorney General release (July 2023: Vision Solar LLC suit with DOJ + FTC; Solar Xchange $13.8M partially suspended penalty); Post Solar Services (October 27, 2026: Titan Solar Power closure 2024; Residential Contractors’ Recovery Fund $30,000 cap); FOX 10 Phoenix (July 23, 2026: Registrar of Contractors complaint process); ACC docket S-21386A-26-0029 (November 2026: Mesa solar-company founder, $2,433,000 restitution, ~$984,696 misappropriated); FTC Cooling-Off Rule (16 CFR Part 429).
State scale: SEIA/Wood Mackenzie (September 2026: 13,198 MWdc installed, 1,953,899 homes, 337,098 installations, 18,435 MW projected next 5 years, ranks 3rd, ~18.23% of state electricity) — see SEIA Arizona fact sheet. Cross-check source: Ecogenamerica Arizona solar incentives 2026.
EXCLUDED: Phoenix Valley Solar’s 8.46¢ and 7.47¢ APS RCP figures (contradicted by the APS tariff PDF); any single hard-coded E-27 export rate (sources disagree ~2×); any claim of an Arizona Solar for All program (unverified); the Texas-style 10% HOA output threshold (does not exist in Arizona law); the APS ~14% rate-increase proposal as fact (unverified proposal only); any Arizona-specific tile-roof solar cost adder (unverified — no figure invented).
*Disclaimer: Prices are 2026 Arizona planning figures and change by utility territory, roof, and installer. Always get 3 written local quotes before budgeting. Tax information is general, not tax advice — confirm with a tax professional. Export rates reset on utility calendars (APS September 1, TEP/UNS October 1, SRP May) — verify the current tranche with your utility before signing.*
—
How much do solar panels cost in Arizona in 2026?
Solar panels cost $2.25–$2.60 per watt installed in Arizona in 2026 (EnergySage, November 2026). An 8 kW system runs about $18,000 gross, or $17,000 after Arizona’s $1,000 state tax credit. The Arizona-average 13.34 kW system costs $30,081.
Is there still a federal solar tax credit in Arizona in 2026?
No — $0 for homeowner-owned systems. The §25D residential credit ended for installations completed after December 31, 2025 (OBBBA, P.L. 119-21; IRS FS-2025-05). Arizona’s own 25% state credit up to $1,000 survives, and leased systems may still benefit from the §48E credit through December 31, 2027.
Does Arizona have net metering?
No — Arizona ended full-retail net metering in 2016–2017 and now uses net billing. New applicants earn 5.554¢ per exported kilowatt-hour on APS, 4.62¢ on TEP, and 1.87¢ on SRP (E-16/E-28 plans). Electricity you use directly is worth the full retail rate of about 15¢, so self-consumption is worth roughly 3–7 times more than exporting.
What is the APS solar export rate in 2026?
5.554¢ per kilowatt-hour for the September 1, 2026–August 31, 2027 tranche, locked for 10 years from interconnection (APS Rate Rider RCP tariff, ACC Decision No. 82122). The rate steps down up to 10% each September 1, so later applicants get a lower locked rate.
Can my HOA stop me from installing solar panels in Arizona?
No. Arizona law bars it twice over: A.R.S. §33-1816 stops planned-community HOAs from prohibiting solar, and A.R.S. §33-439 makes any deed restriction that effectively bans solar void and unenforceable. HOAs may set reasonable placement rules, but only if they do not prevent installation, impair function, or hurt cost or efficiency. The protection does not apply to condominiums.
Will solar panels raise my property taxes in Arizona?
No — A.R.S. §42-11054 permanently excludes 100% of the added home value from assessment, and there is no form to file. Solar equipment is also exempt from Arizona sales tax (Transaction Privilege Tax) under A.R.S. §42-5061(M).
Do I need a battery with solar panels in Arizona?
Strongly recommended on SRP, where exports earn only 1.87¢ and demand charges can add $30–$70 a month if unmanaged. A battery is also valuable on APS, where it shifts 5.55¢ exports into 30–37¢ peak self-use and earns about $110 per kW per year in VPP payments. A Tesla Powerwall 3 (13.5 kWh) runs about $15,000 installed with new solar.
How long until solar pays for itself in Arizona in 2026?
About 11–13 years for an APS customer and about 13–15 years for SRP solar-only, on our modeled 8 kW system. EnergySage’s statewide figure is 12.9 years for the average 13.34 kW system. Our worked 8 kW APS model pays back in about 10.8 years net of the $1,000 state credit, with roughly $31,000–$32,000 net over 25 years.